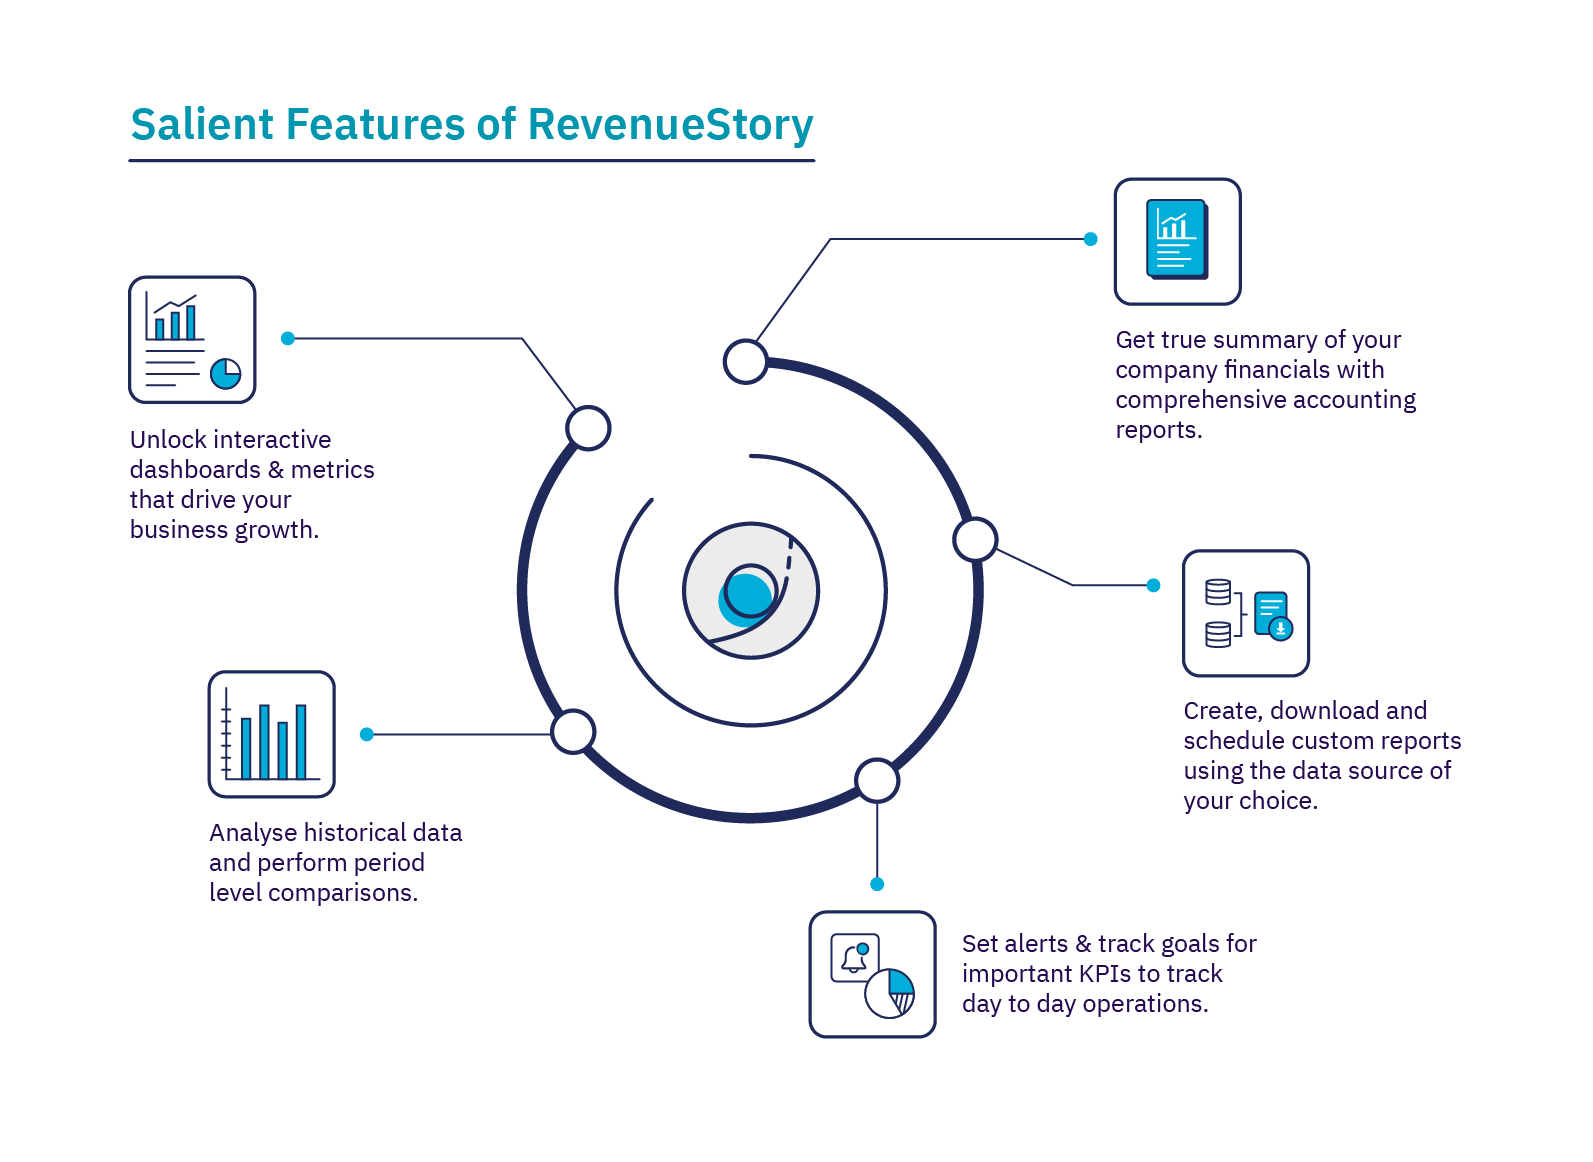
RevenueStory gives you a 360° business visibility on subscription analytics. It helps you identify the key performance indicators driving revenue, subscriptions, signups, activations, churn and a host of other metrics that you need to make effective decisions. It associates your product metrics with revenue metrics and customer behaviour thereby facilitating the growth of your business .
The RevenueStory module has more than 150+ ready-made reports that helps you derive actionable insights on new sales, payments collected, monthly recurring revenue (MRR), activations, churn, and so on. You can access these reports from the RevenueStory tab.
Dashboards provide a consolidated way to view all your reports and key performance indicators in a single page. RevenueStory has 10 default dashboards that will help you derive actionable insights. They are:
Critical Business Metrics: A real-time dashboard to understand critical metrics related to growth, retention, and leakage and to stay on top of business growth in the uncertain times of COVID-19.
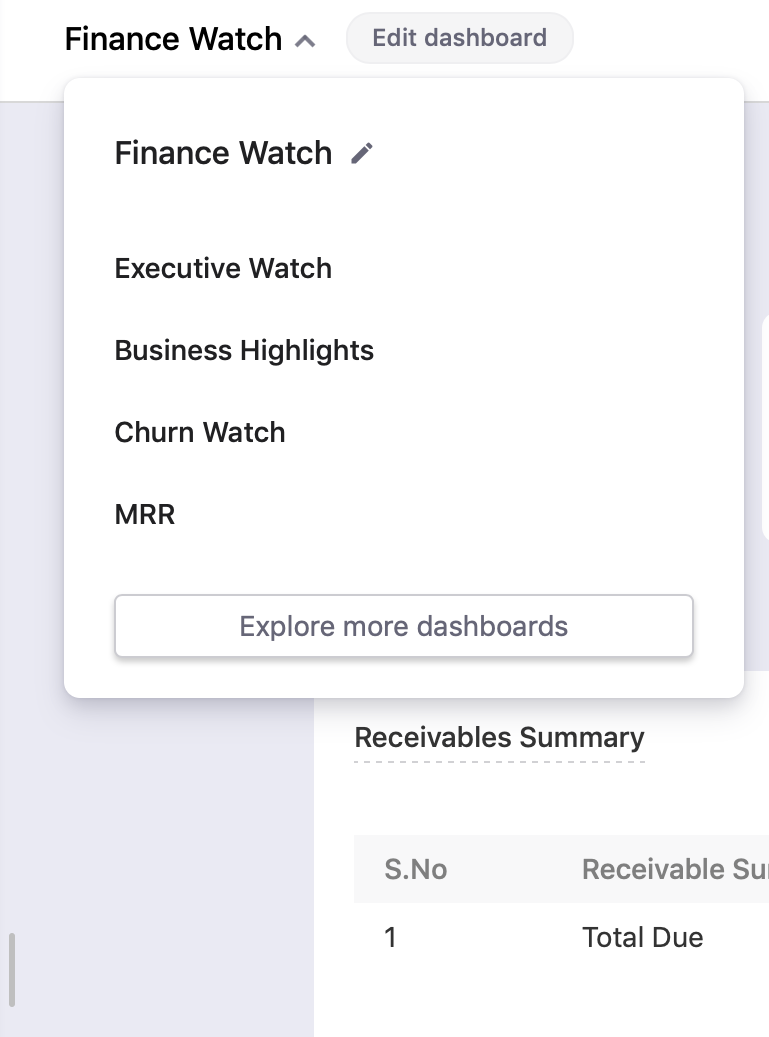
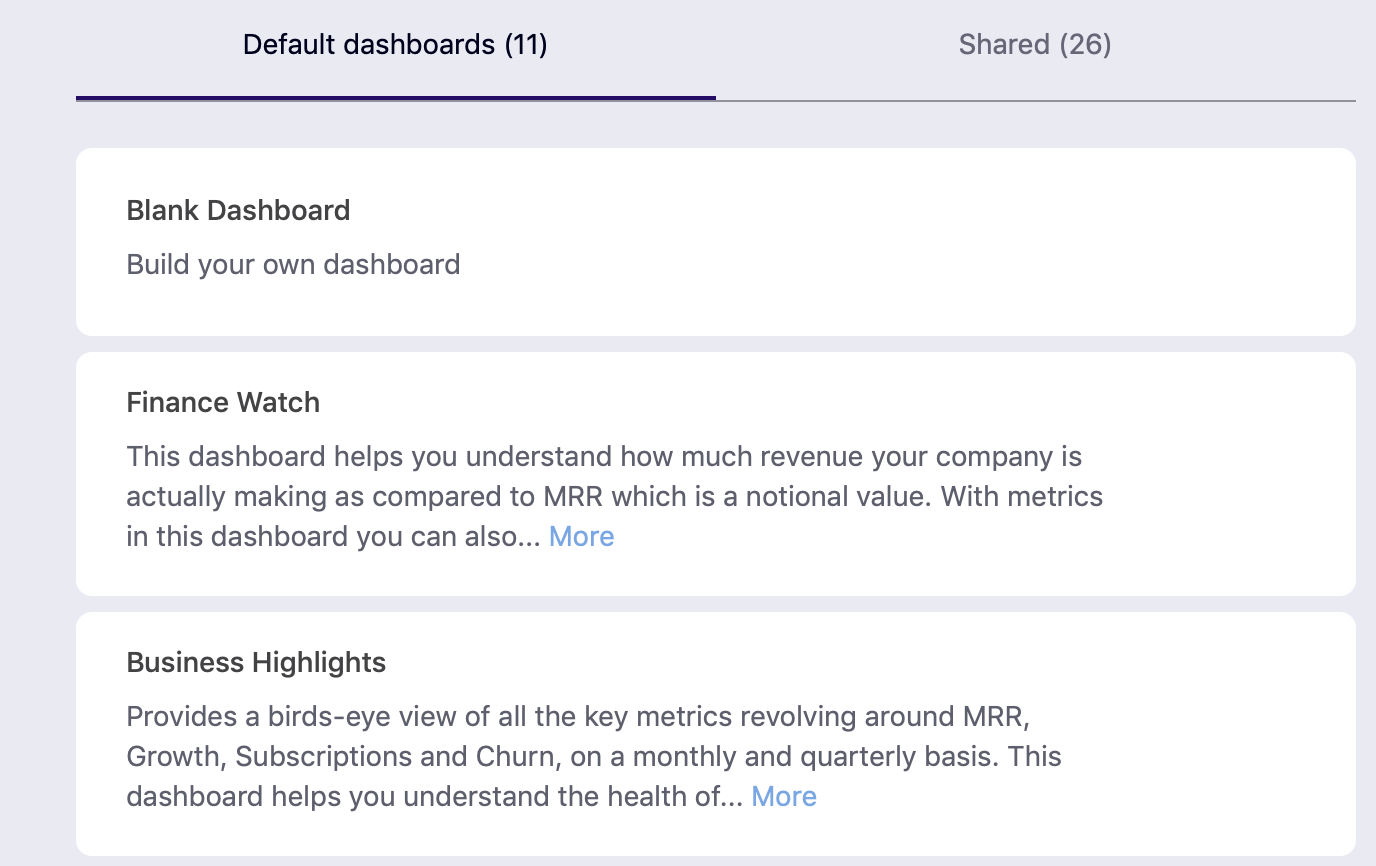
Finance Watch: This dashboard helps you understand how much revenue your company is actually making as compared to monthly recurring revenue (MRR) which is a notional value. By using the metrics in this dashboard you can also get visibility into your cashflow, payments & refunds, and credit card expiry.
Business Highlights: Provides a birds-eye view of all the key metrics revolving around MRR, growth, subscriptions and churn, on a monthly and quarterly basis. This dashboard helps you understand the health of your business and see if you are on track.
Executive Watch: You can view historical trends with metrics around MRR, MRR growth, retention and Churn broken down over the course of several months. This dashboard provides insights into your performance today, in comparison with the same metrics from the previous month. Use this for a detailed view of your growth for stakeholders and investors.
Marketing Watch: This dashboard displays the metrics that impact the top of the funnel, like signups, activations, and new revenue. This dashboard also includes insights about more long-term activities like subscription retention and MRR growth cohorts, and net dollar expansion that allow marketing teams to see the impact of their acquisition strategies over a longer time frame, and identify emerging markets.
Sales Watch: Consists of top revenue metrics like New MRR, Expansion MRR, Upgrade MRR, and ARR, segmented by plans, geographical territories and verticals. This dashboard allows the Sales team to identify which industries, geographies, plans and even sales reps contribute to the most revenue.
Customer Success Watch: You can use this dashboard to monitor and track your customer success initiatives. It displays the subscription and revenue churn, upgrade and downgrade MRR, net churn rate and a cohort view of customer churn, in addition to a time-based breakdown of when customers churn.
Monthly Watch: It displays all the components that affect your MRR on a month-on-month basis, like New MRR, MRR from free to paid conversions, expansions, and the loss of revenue due to Cancellations, Downgrades, and Scheduled Cancellations. This dashboard also gives you an insight into your Metered Charges, LTV and CAC, and monthly churn both in terms of customer count and lost dollar value.
Subscription Watch: Shows a collection of all the core KPIs to provide a holistic perspective into your subscription lifecycle, like signups, activations, churn, and so on. Use this dashboard to understand how your business metrics have evolved on a weekly or monthly basis. This dashboard is useful when you have to compare the dynamic and long-term trends in your subscriptions simultaneously.
Churn Watch: This dashboard displays all the metrics and trends you need to track with respect to churn.
Weekly Watch: Shows the more dynamic KPIs that you would need to track on a week-on-week basis, like signups, activations, MRR addition, and churn. This dashboard shows if you are on the right track to meeting your monthly targets.
You can view any of default dashboards by clicking on them. If you wish to import these dashboards and make changes to them, click Save. These dashboards can be customized at a user level. You can add or delete a metric in these dashboards. The changes that you make here will be visible only for you.
Creating a new dashboard
In addition to the 10 default dashboards, you can create a blank dashboard and add the metrics you want. The dashboards that you create will be visible only to you, by default.
If you'd like your colleagues to view the dashboards that you create, you can share it with them. Users who have access to RevenueStory (Admin, Owners and Finance Executives) will only be able to view them.
To create your own dashboard:
Click RevenueStory > Dashboards
Select Explore more dashboards from the toggle
Select Blank Dashboard
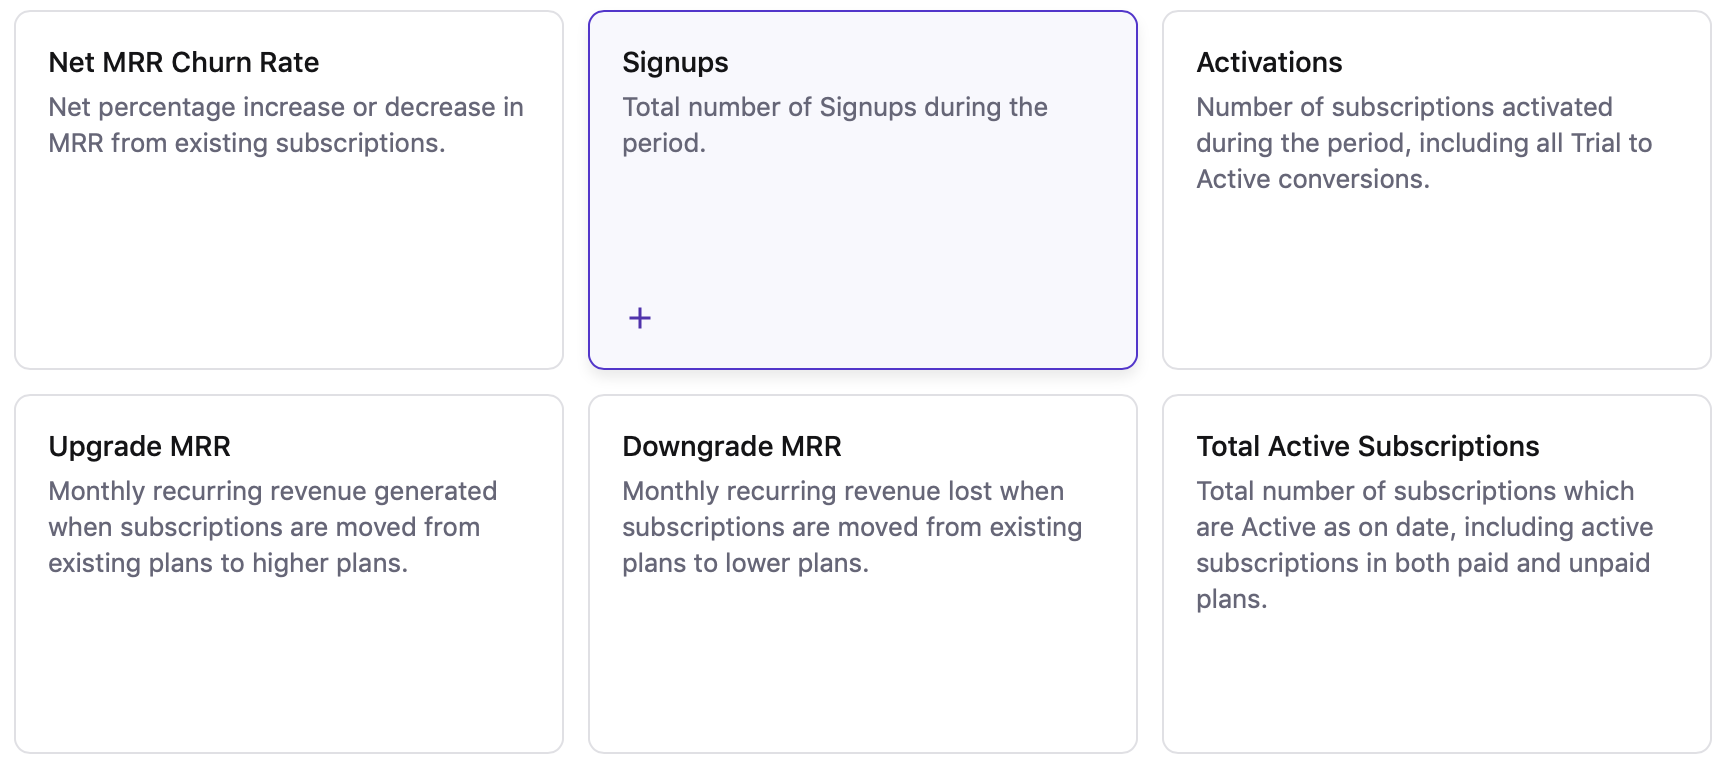
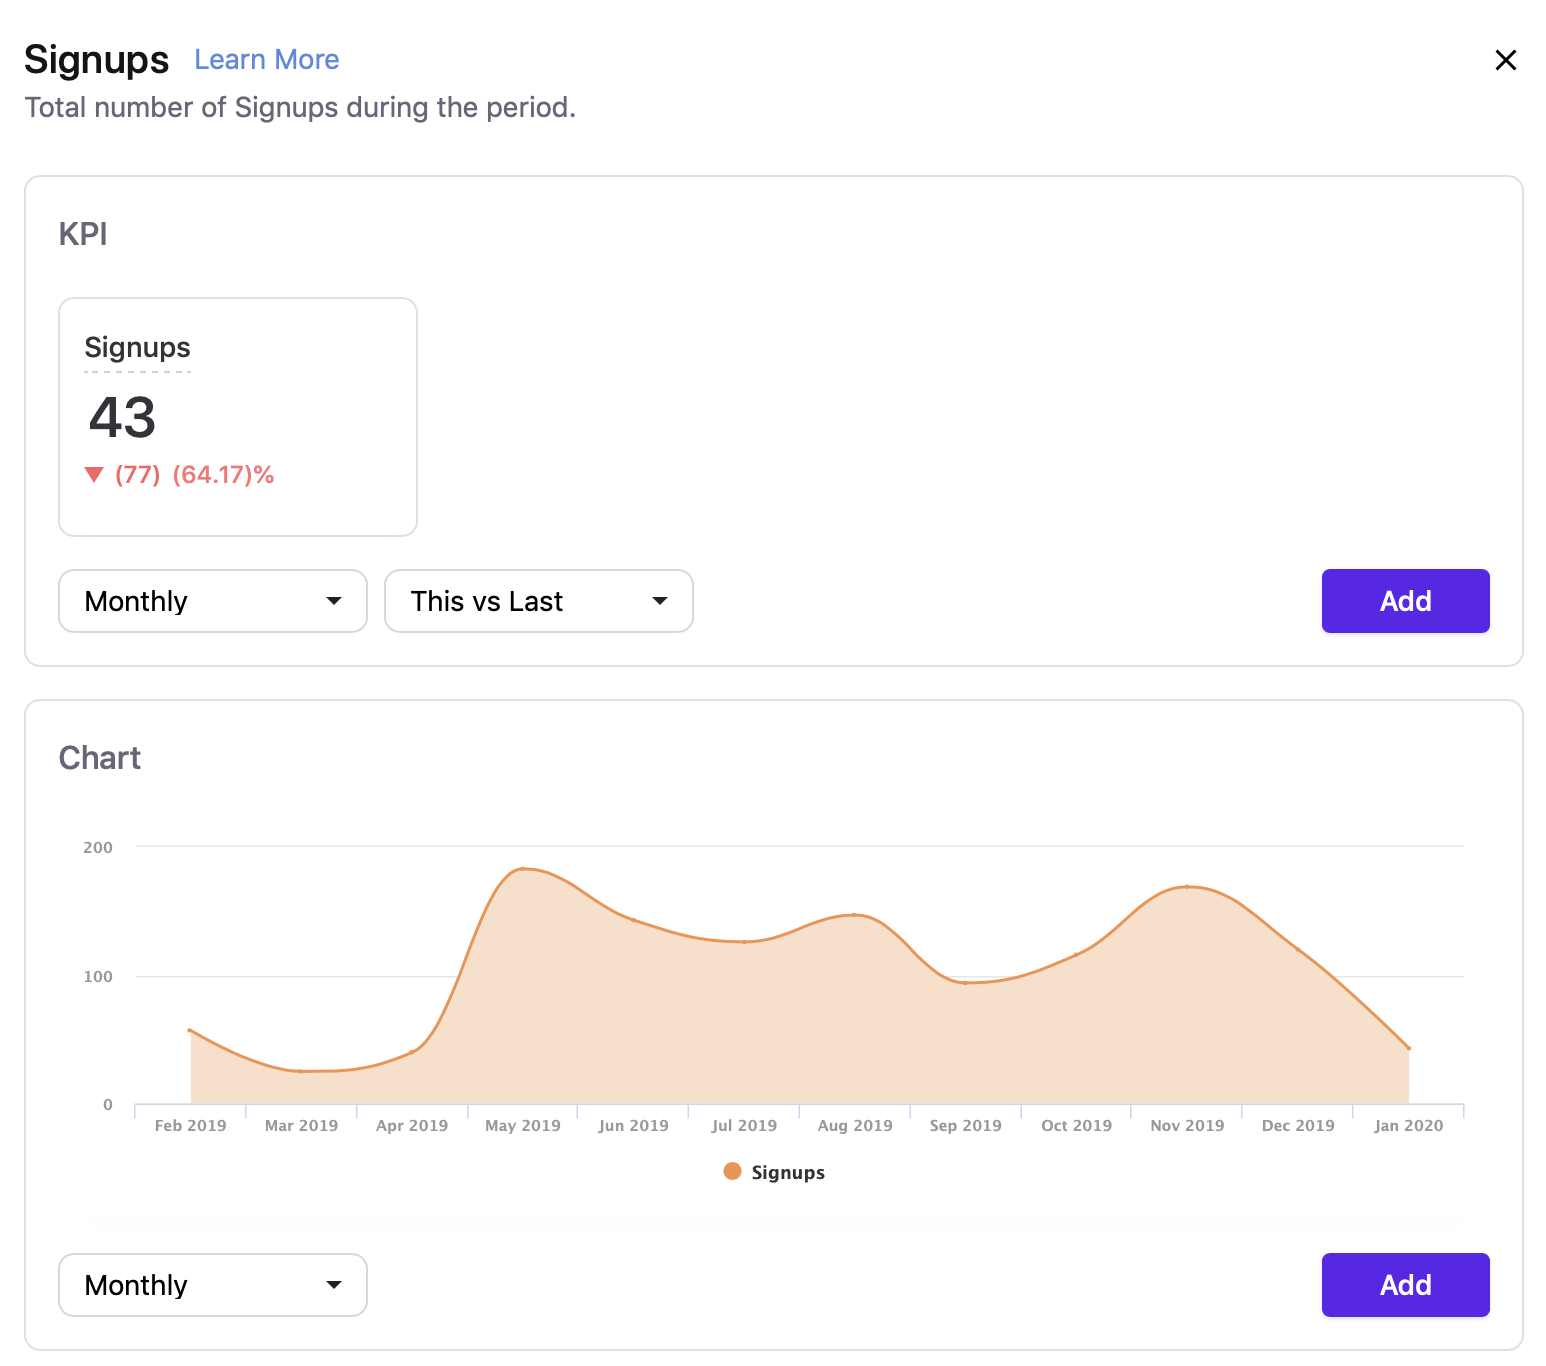
Chargebee has various in-built metrics that you can add to your dashboard. These metrics are available in the form of a KPI, Chart, Table or a Cohort.
To view the complete list of metrics, click RevenueStory > Metrics Explorer.
The metrics that you can add are grouped into the following categories:
You can choose to add a metric from the dashboard settings or from the Metrics Explorer.
To add a metric to your dashboard:
Open the dashboard
Click Add Metric
Select the metric that you want to add.
Choose the time period for the KPI/Chart that you want to add.
Click Add
The metric is added to the dashboard. You can re-position the metric by dragging and dropping it. Click here to view Chargebee's metric manual.
Alternatively, you can select and add the metric that you want into your dashboard from the Metric Explorer tab.
To do this:
Click RevenueStory > Metric Explorer
Select the Metric

Choose the time period for the KPI/Chart that you want to add.
Click Add
You can select any number of metrics that you want to add. Once done, click Add to dashboard.

Chargebee offers a wide range of interactive options for the dashboards. You can apply filters, share, and download underlying data.
Applying Filters: You can filter your dashboard using the fields from Customer, Subscription or Product resources.
To filter your dashboard:
Click the filter icon.

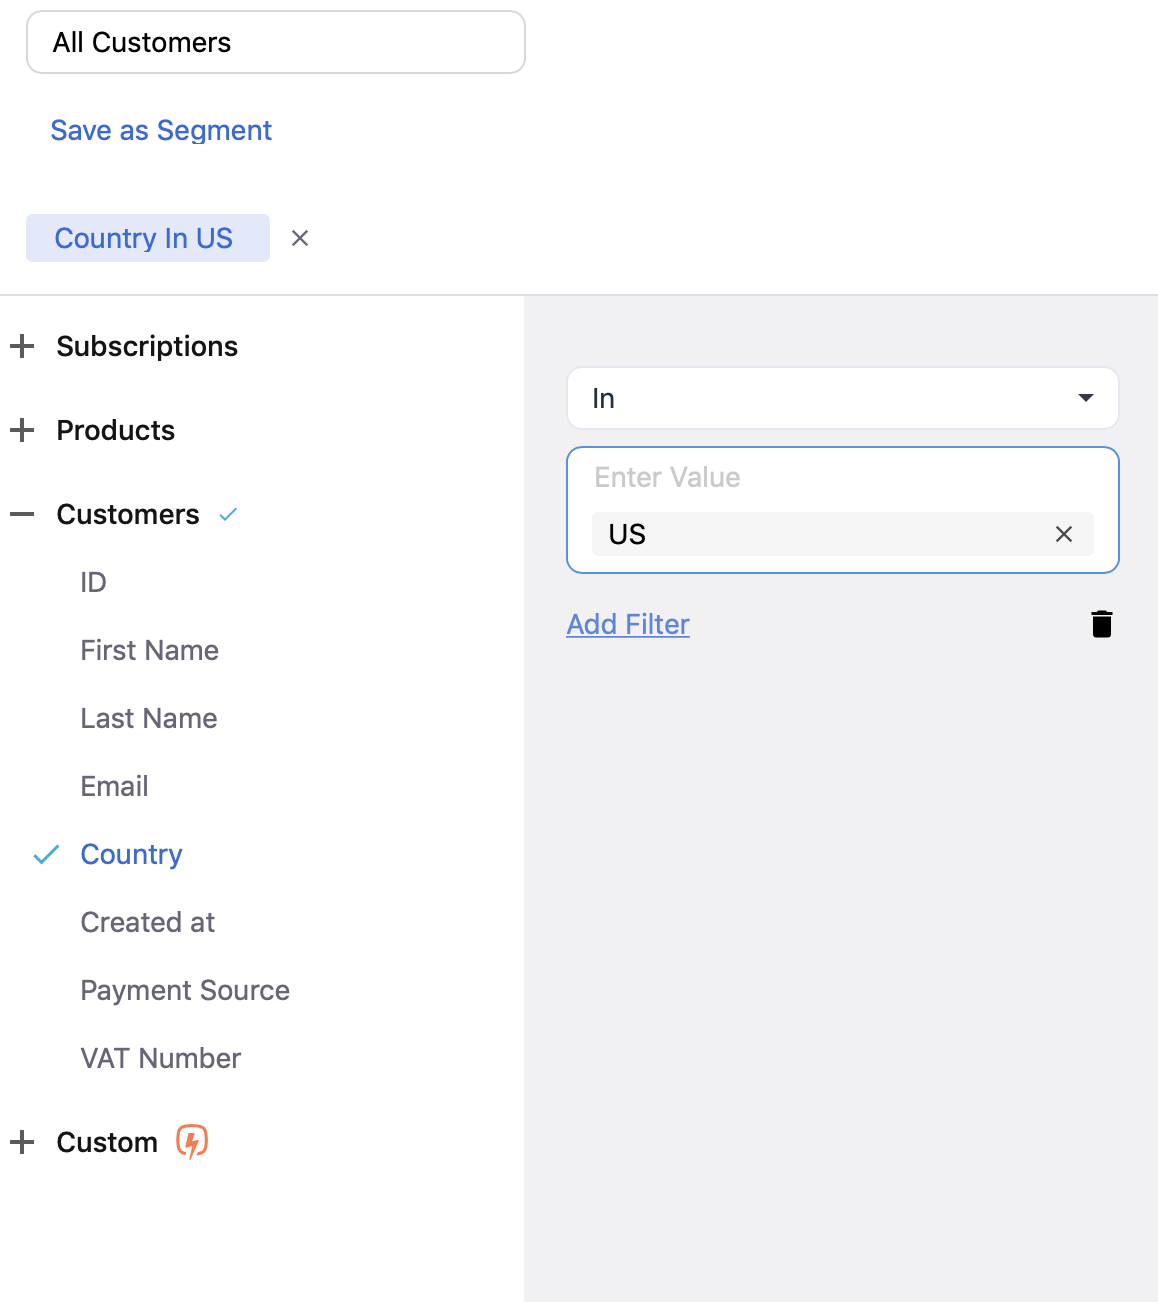
Select the Resource and the corresponding field.
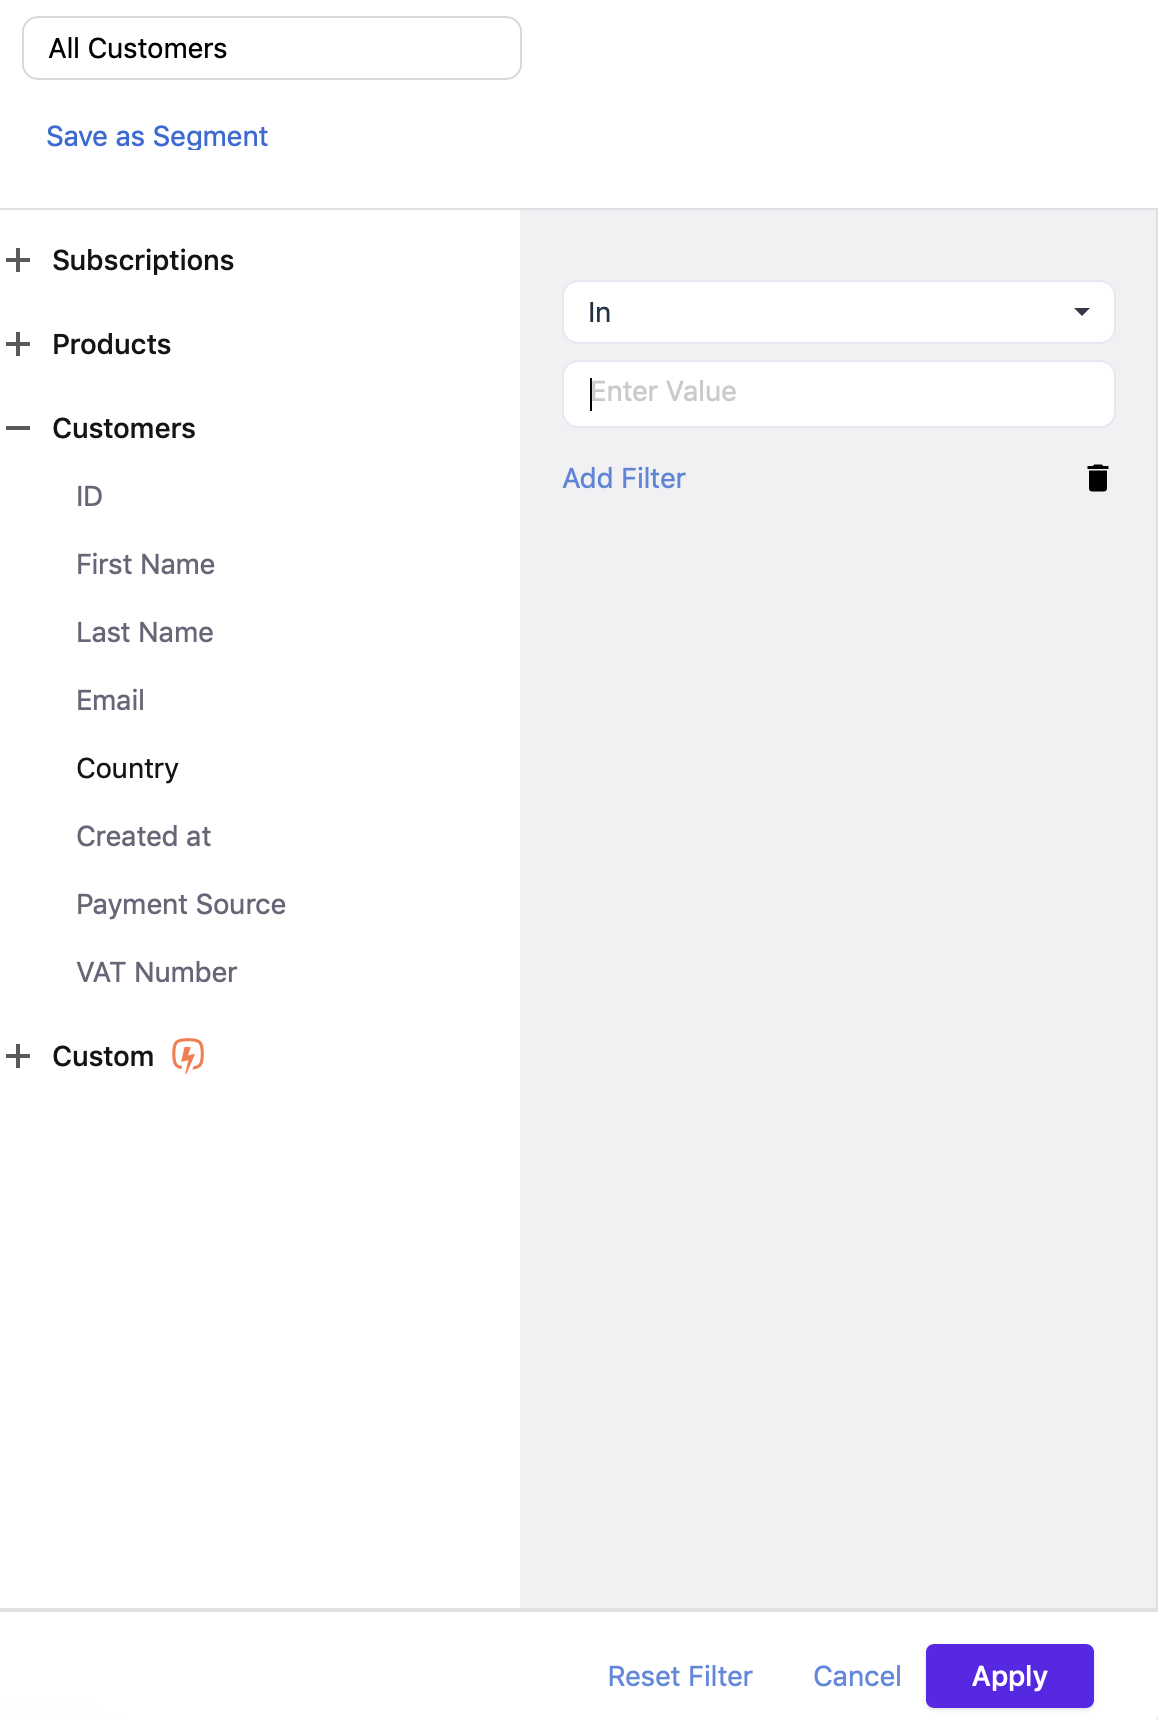
Select the filter criteria and click Add Filter.
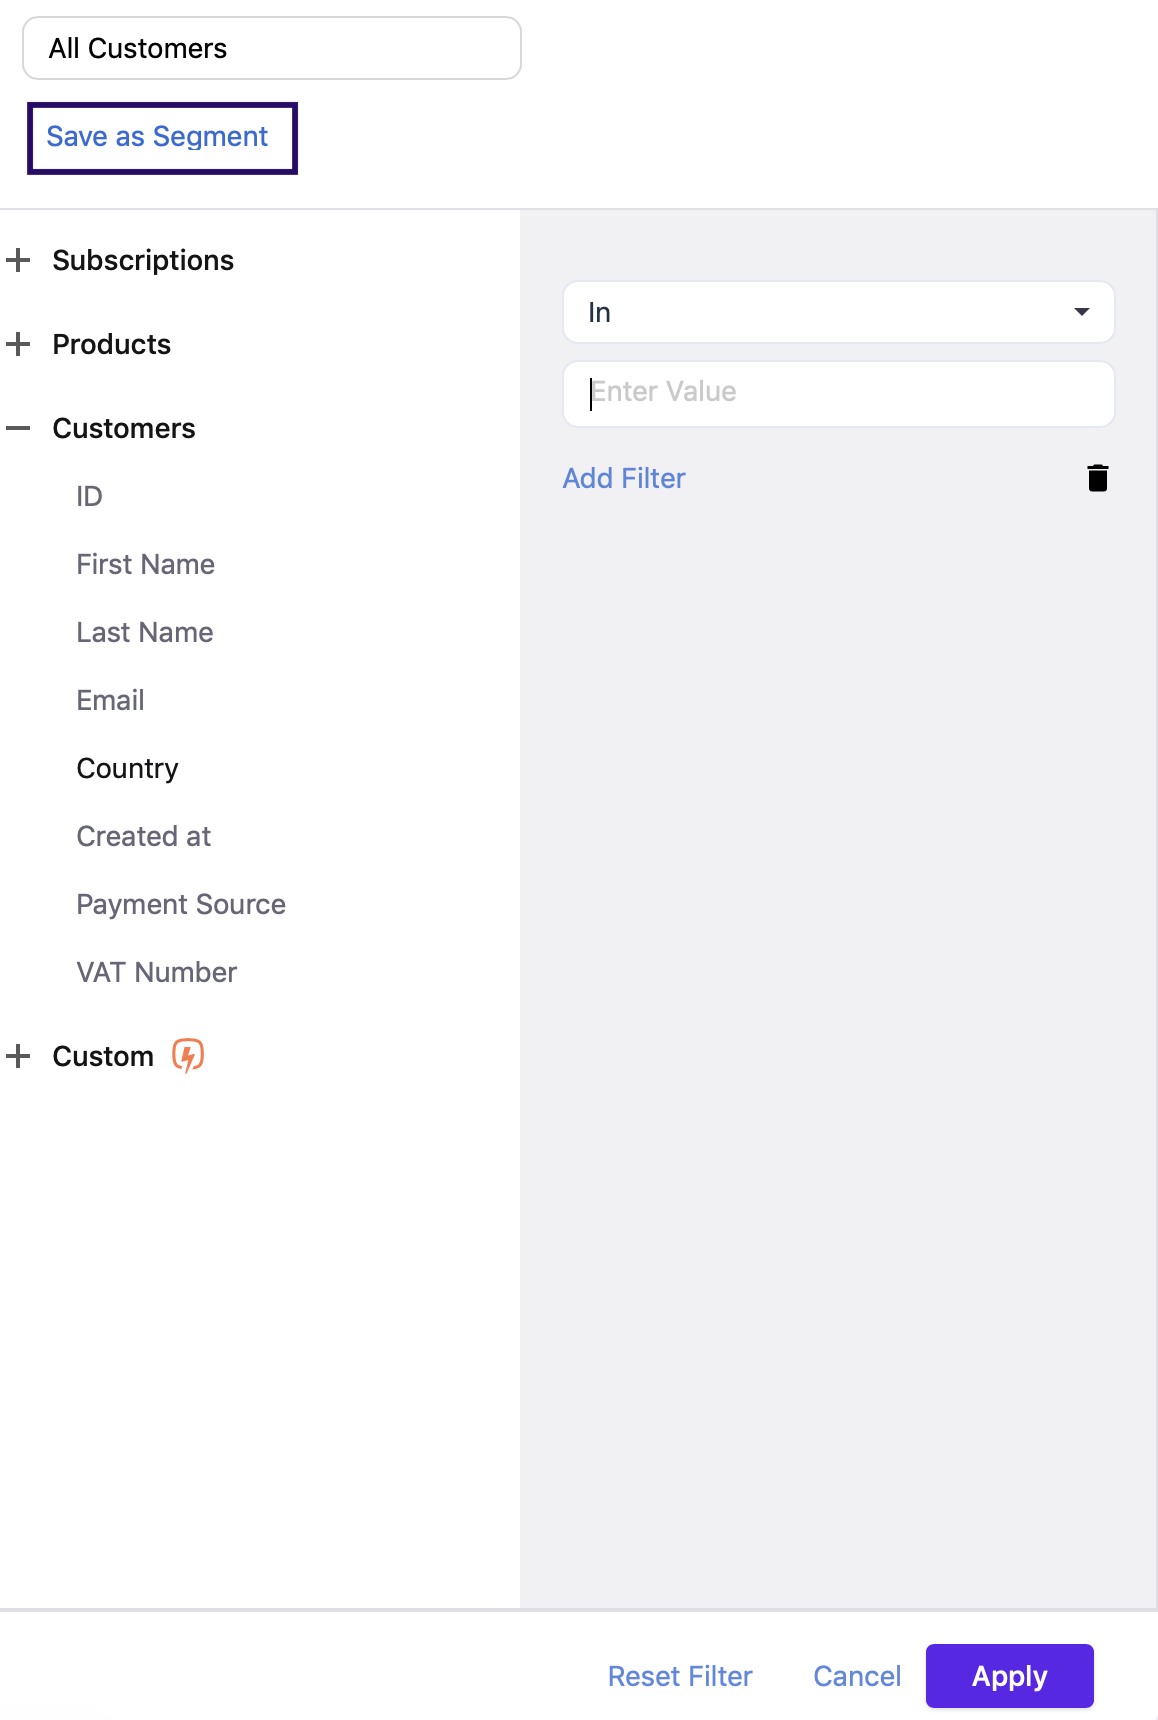
After adding all the intended filters, click Apply.
The filters will get instantly applied to the dashboard. If you want to save these filters for future use, click Save as Segment.
You can use the Scheduling option to email the dashboard to your users automatically on a regular basis.
If you are a Premium user, you can set unlimited schedules. If you are not a Premium user, you can schedule a maximum of 3 dashboards per site.
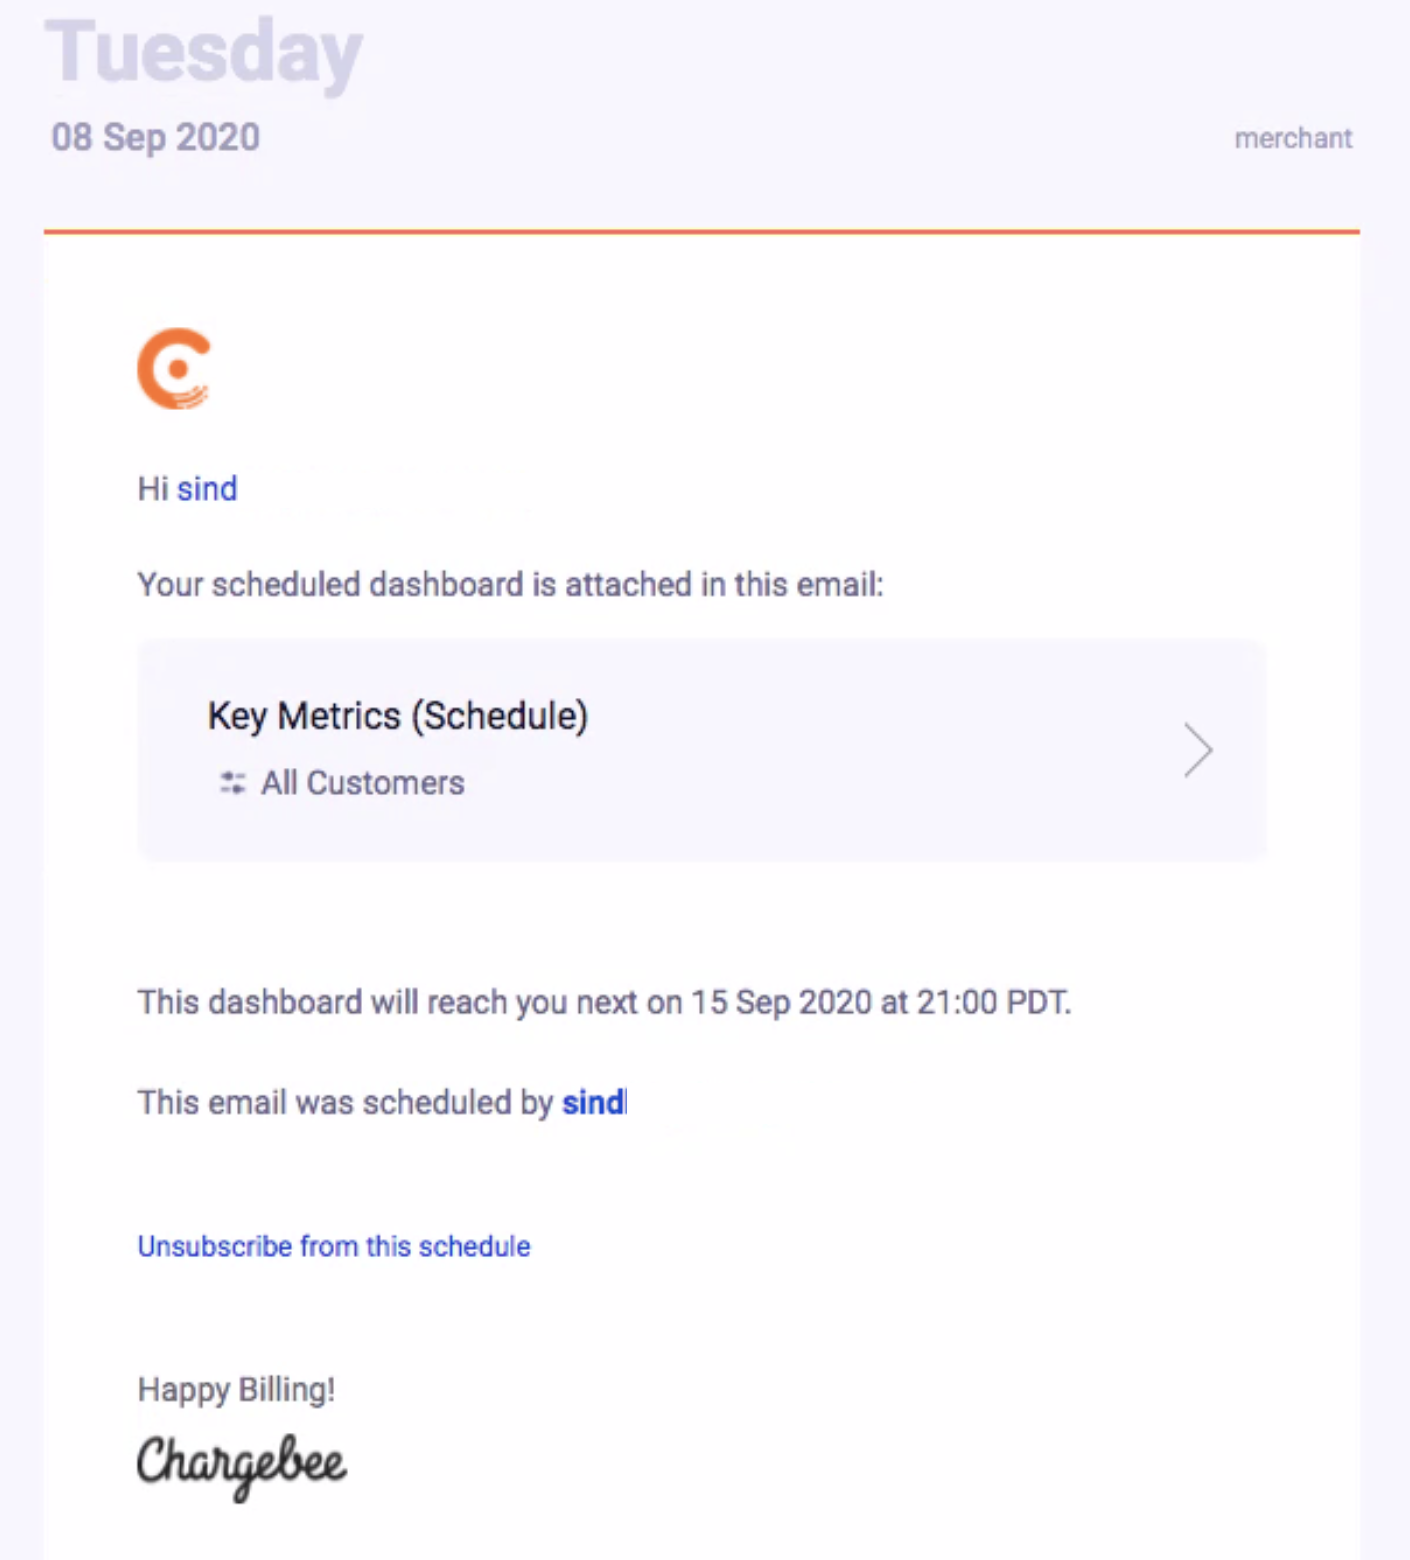
Your users will receive an email with a PDF attachment.
To schedule a dashboard:
Select the dashboard that you wish to schedule and click Schedule.

Select the segment from the drop-down.
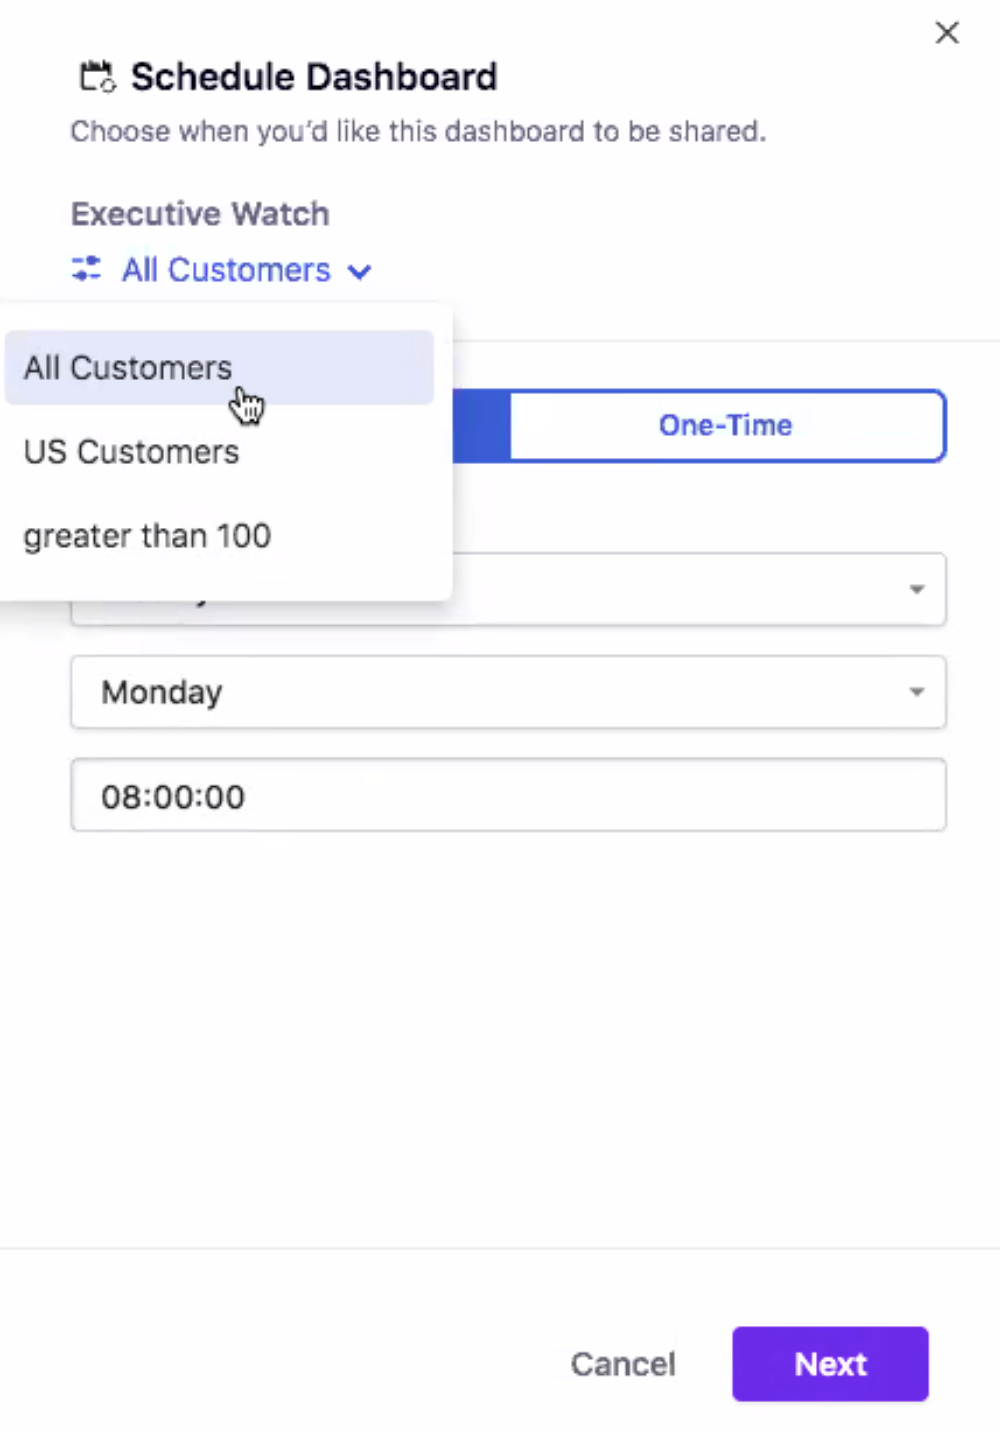
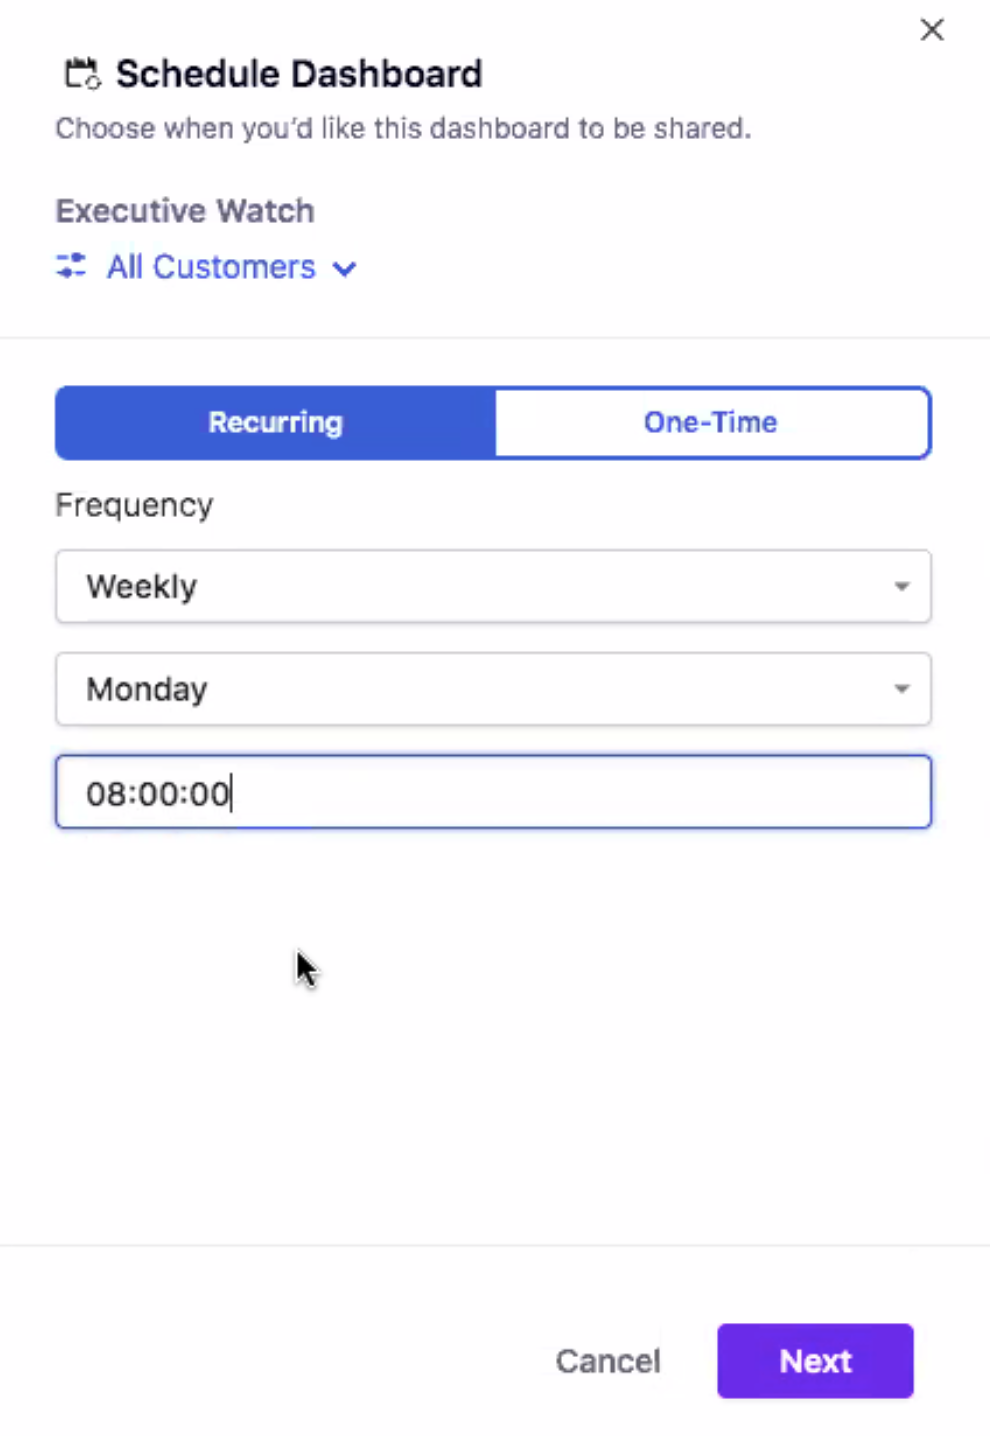
Select how often you would like to send the email. You can choose to email the dashboard on a recurring basis or do it one time. In case you select Recurring, enter the Frequency. Click Next
Select the Users. You can choose to select individual Users added to your Chargebee site or click the Roles tab and select a particular role. When you select a role, the email is sent to all the users assigned to that role.
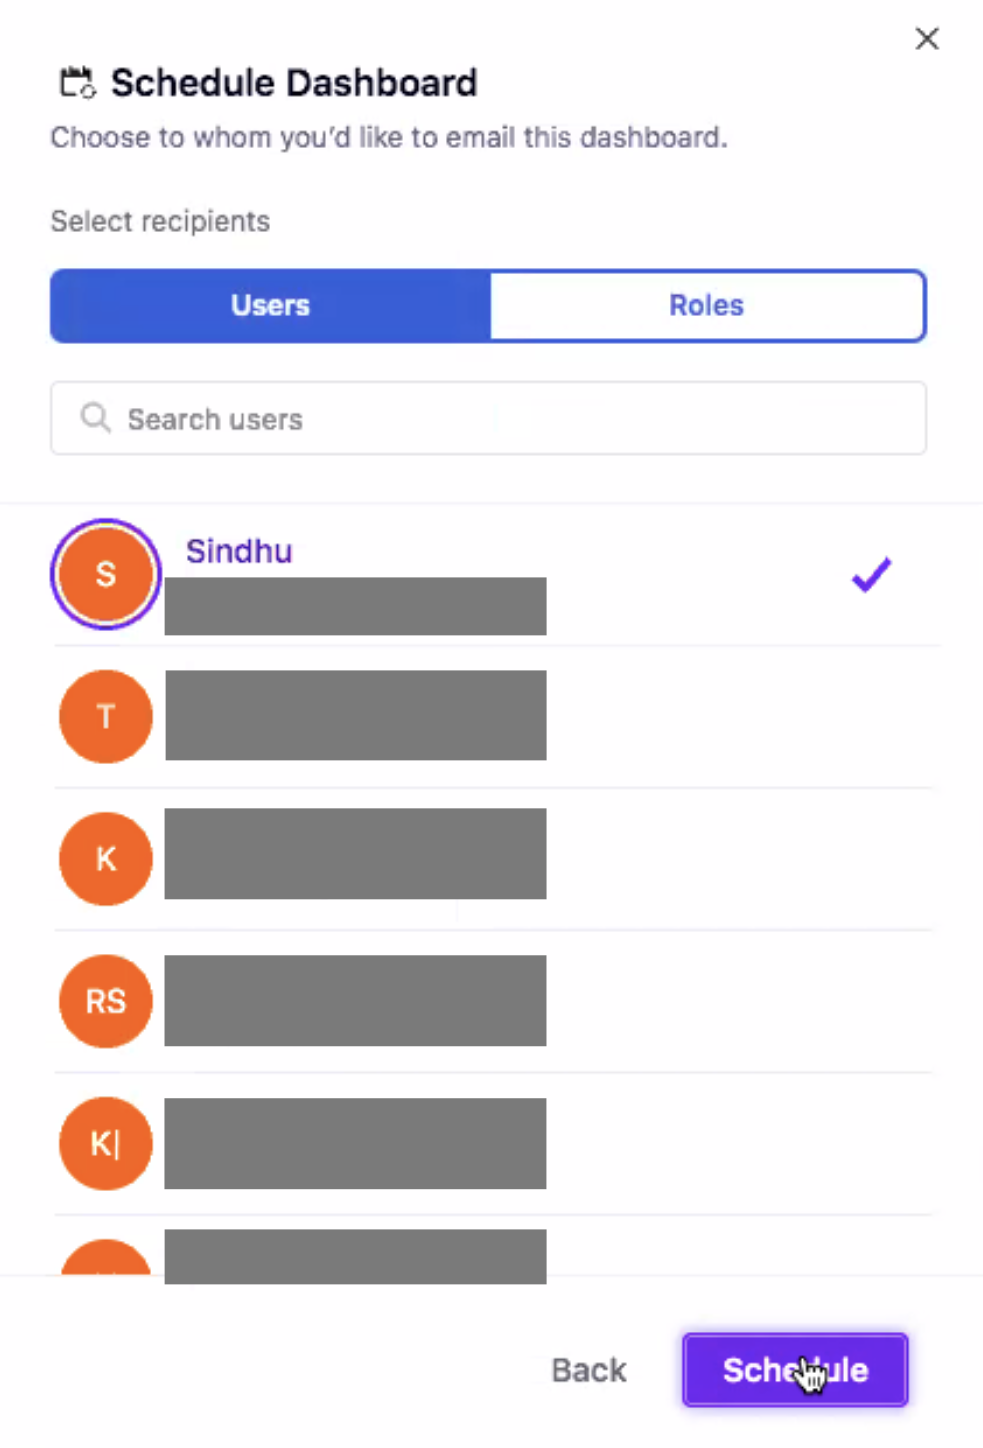
Click Schedule.
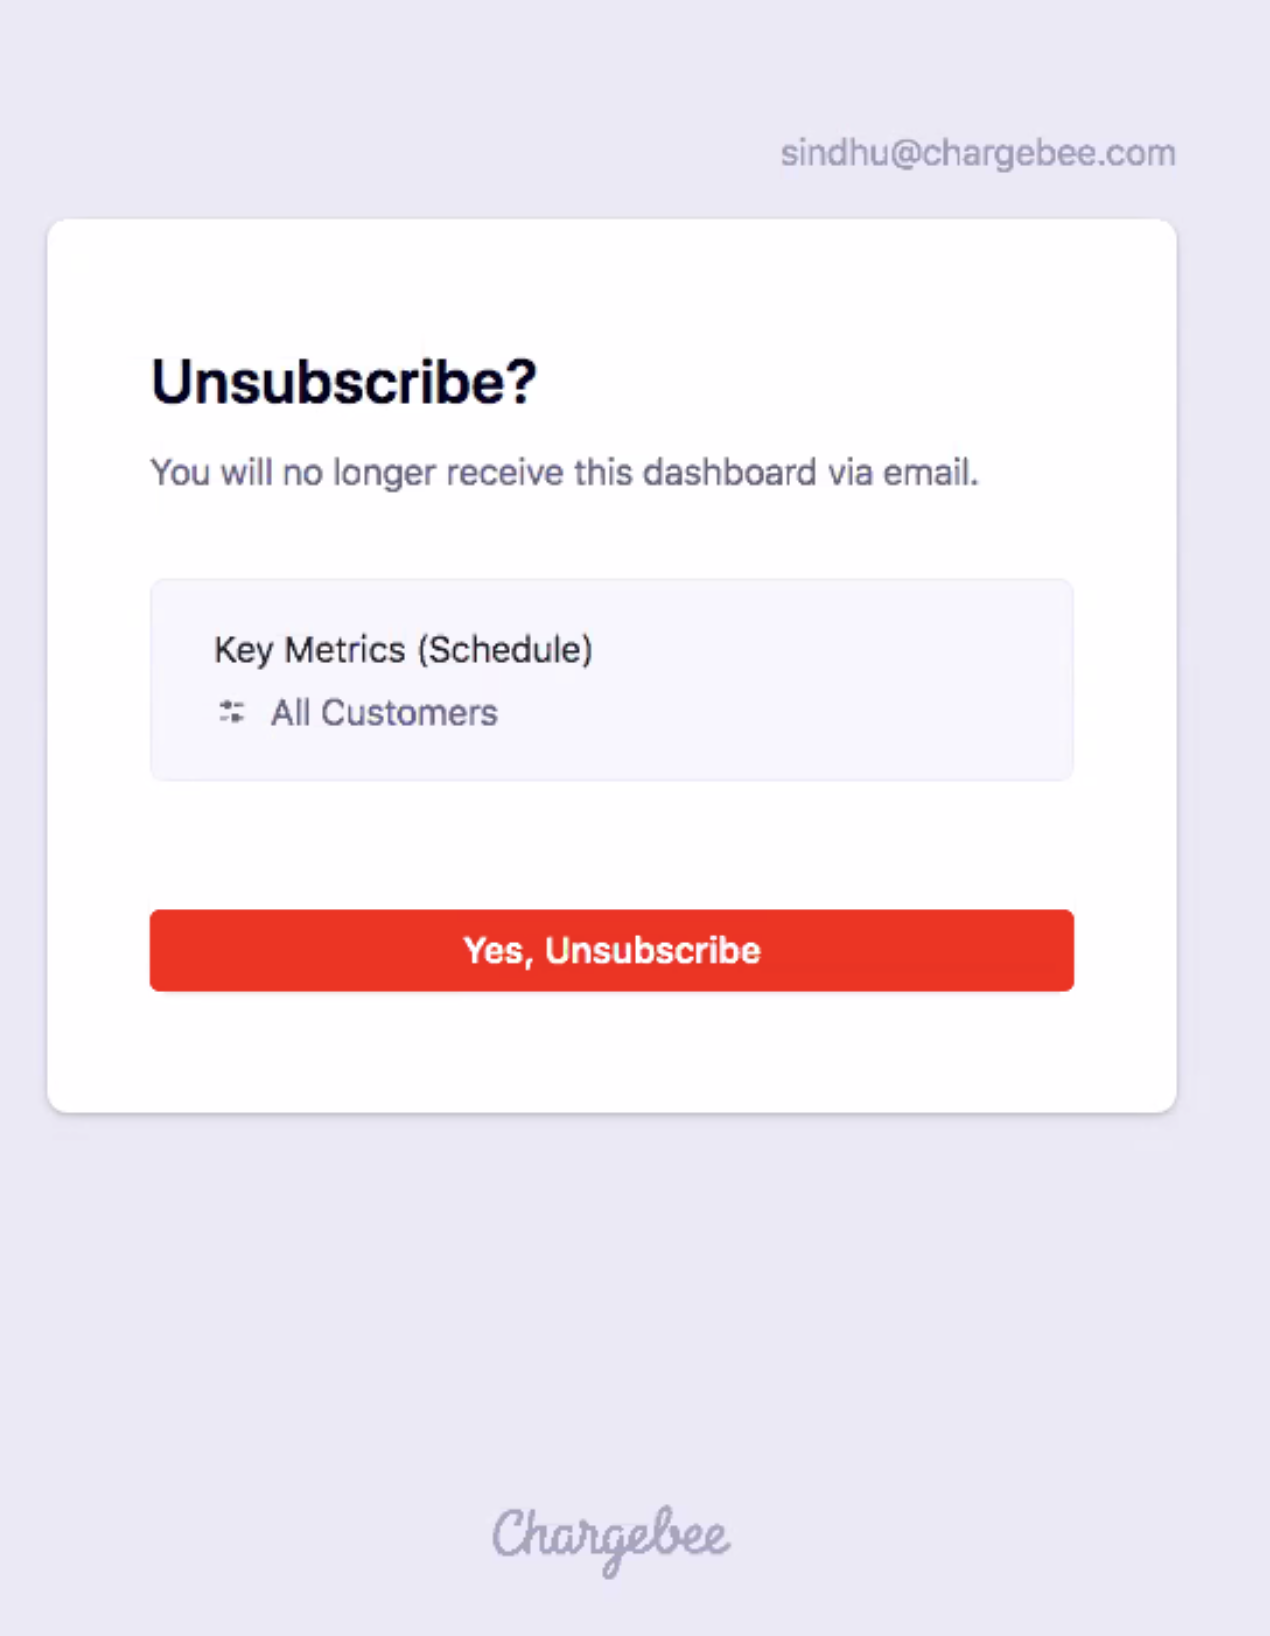
Users can unsubscribe to the dashboard by selecting the Unsubscribe option in the email.
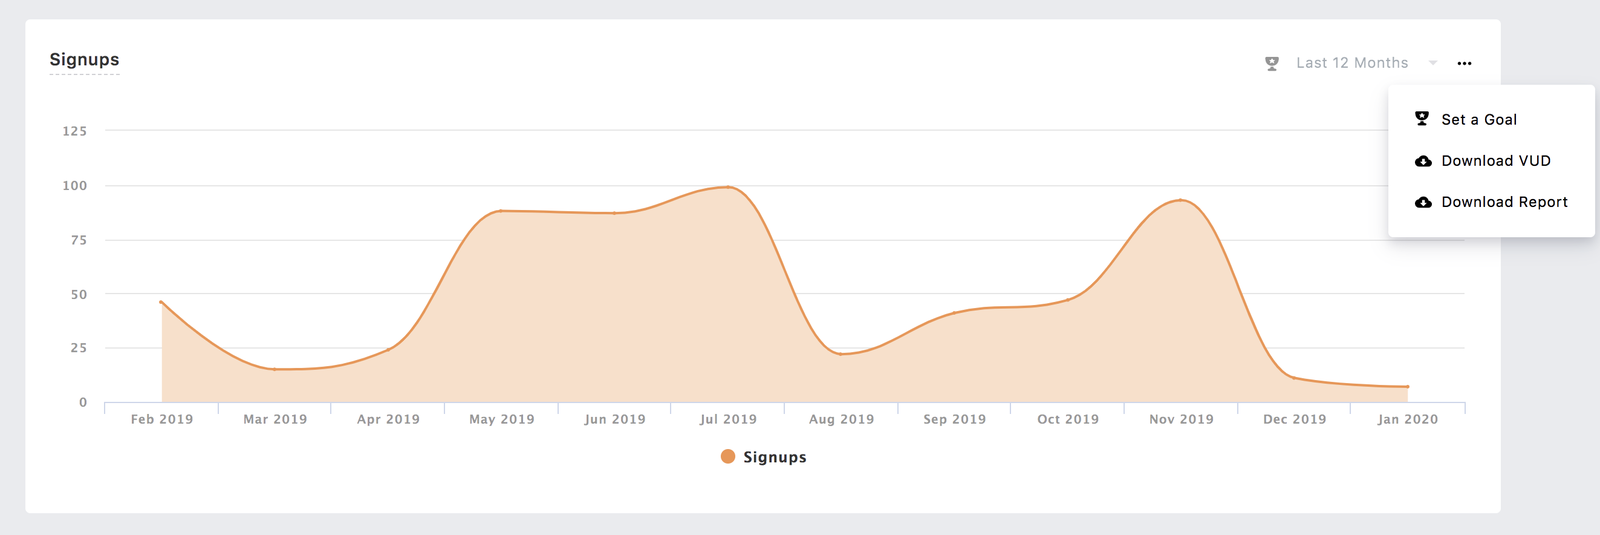
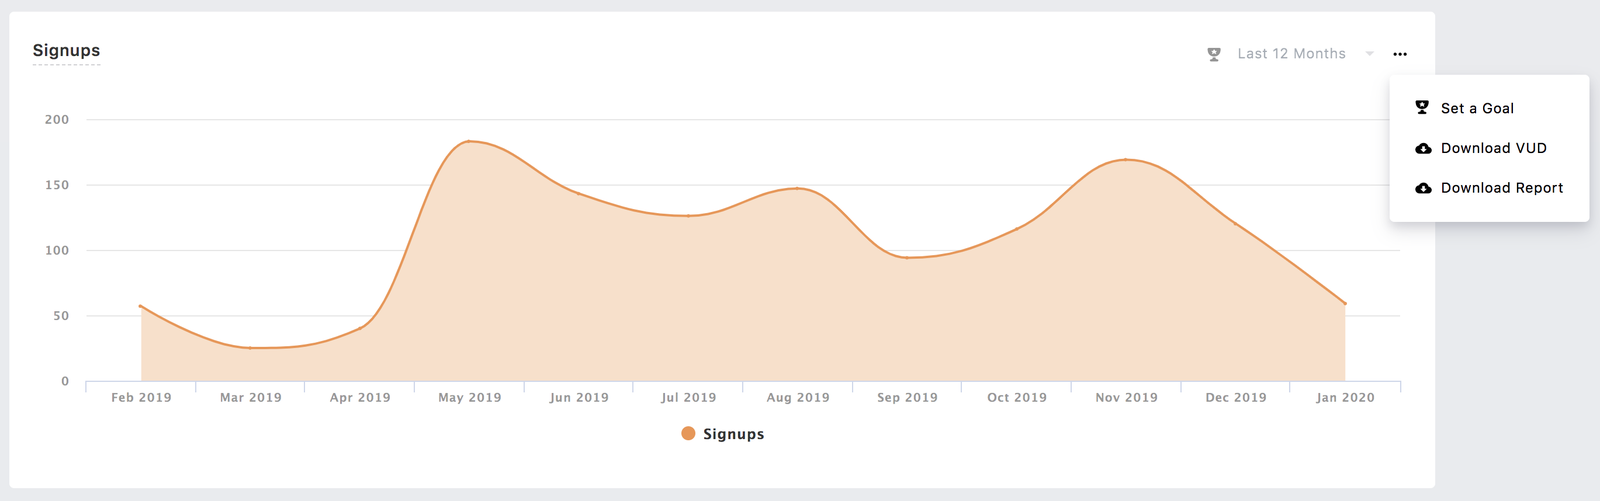
You can download the report and view underlying data by clicking the more icon(ellipsis icon) and choosing the appropriate option.
The download report option converts the chart to a tabular format and downloads it as a CSV file.
The Download VUD option downloads all the underlying data in the report in a CSV format.
You can download the whole dashboard as a PDF by clicking the PDF option in the dashboard.

The dashboards that you create are specific to your account. If you want your colleagues to access the dashboard, you must share it with them.
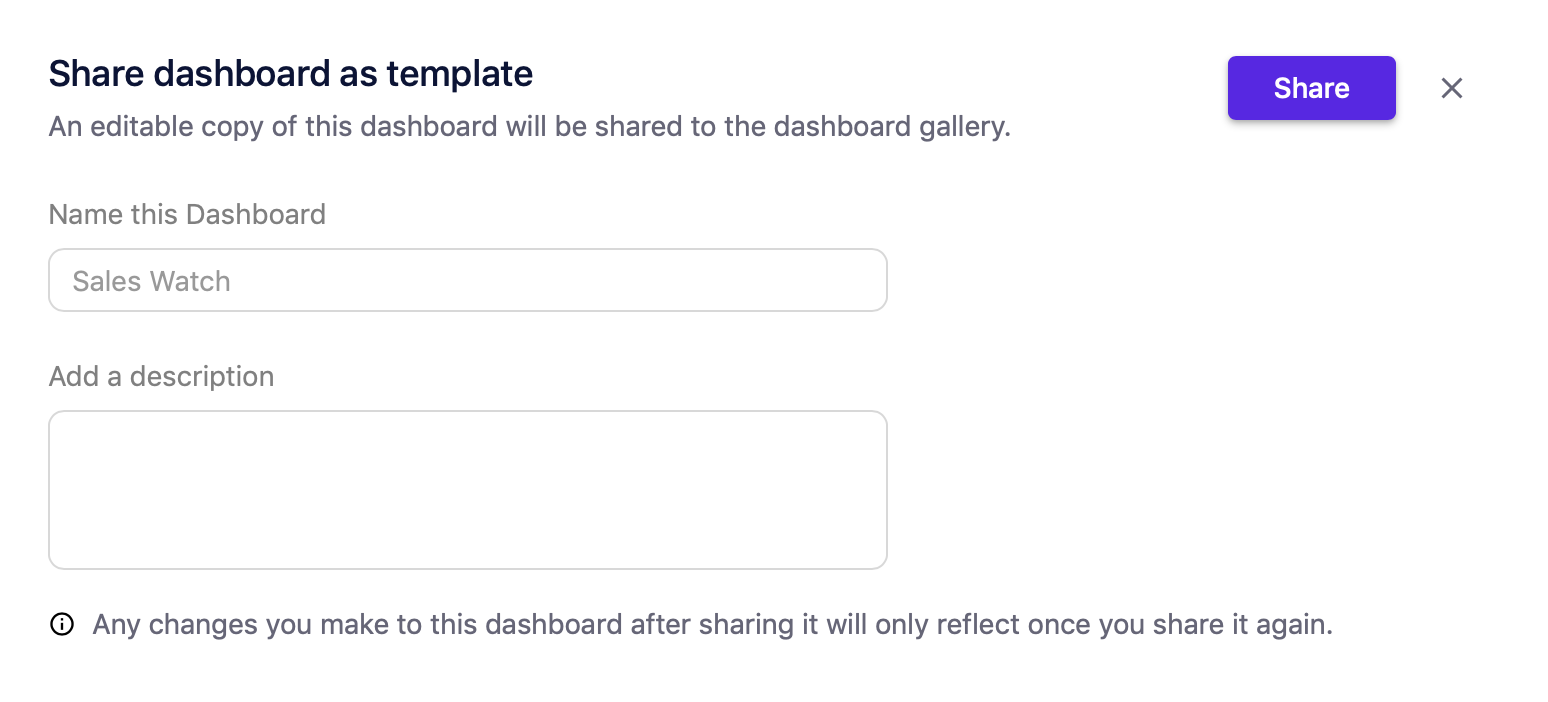
To share the dashboard, click Share dashboard.

The Share dashboard as template dialog opens. Enter the description and click Share.
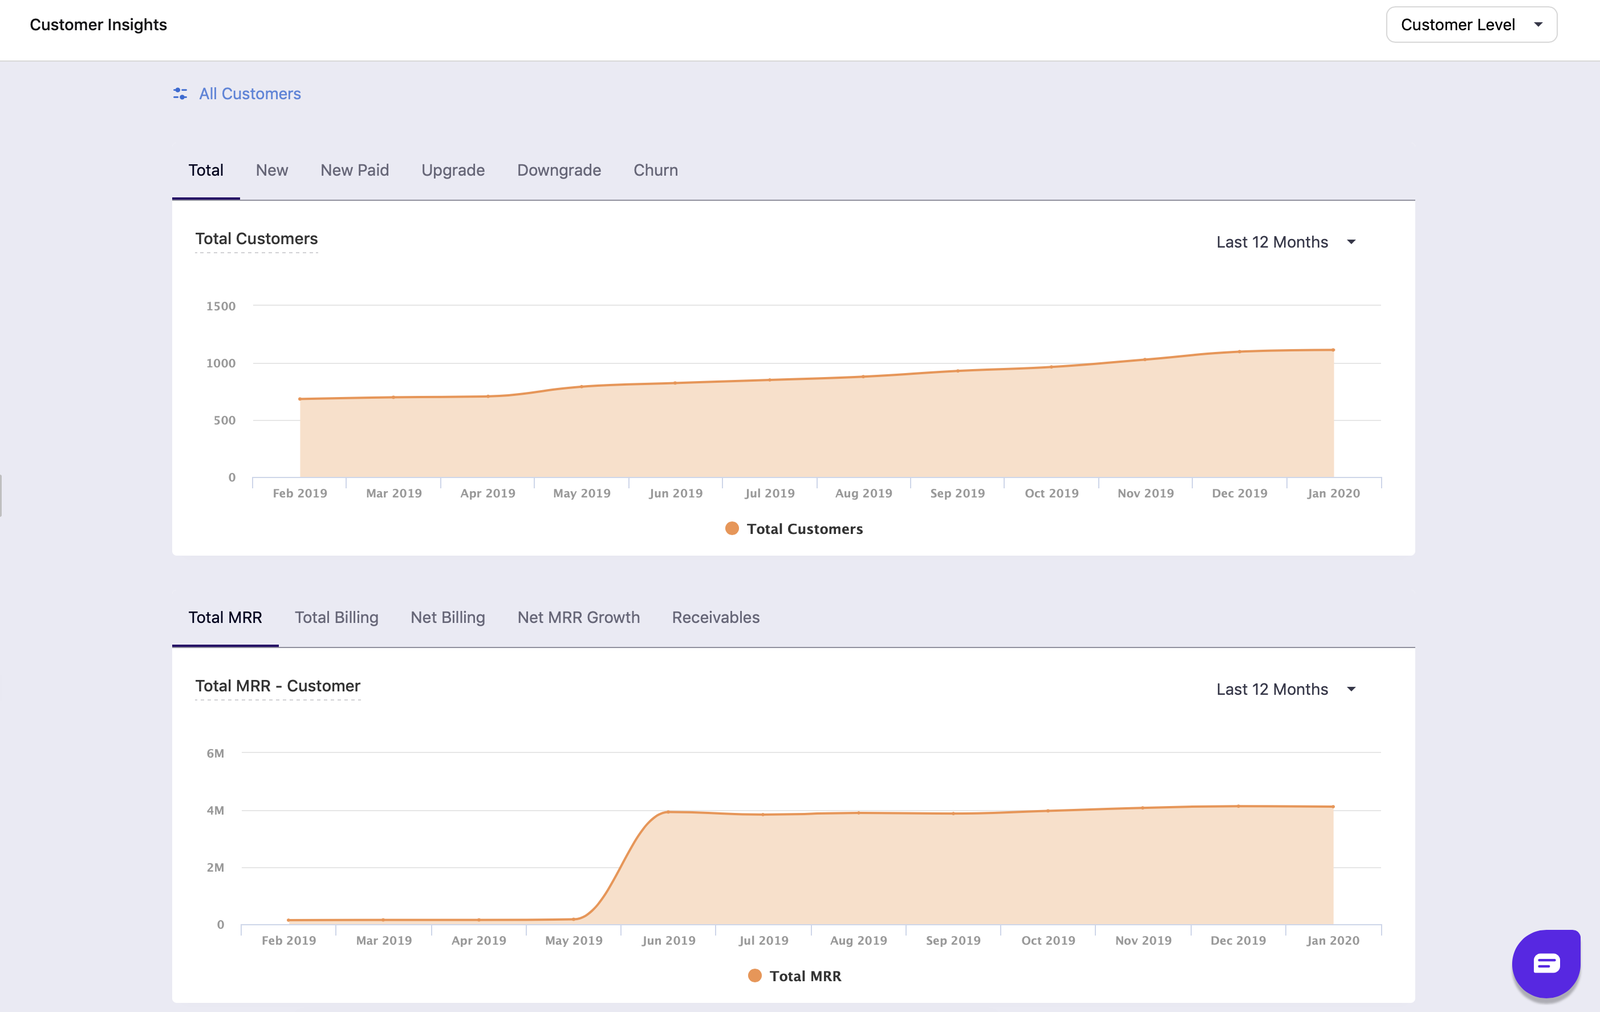
The Customer Insights tab allows you to view reports at a customer level (all the other dashboards displays reports at subscription level).
There are 2 levels at which you can view the reports: Customer level and Parent level.
The parent level view is applicable if you have set up Account Hierarchy.
Alerts are created to notify you when the metric meets the set condition. An email will be triggered to your email when the applied condition is met. You can create an alert for the following metrics.
To create an alert:
Click RevenueStory > Alerts and Goals.
Click Create a Alert.
Select the Metric.
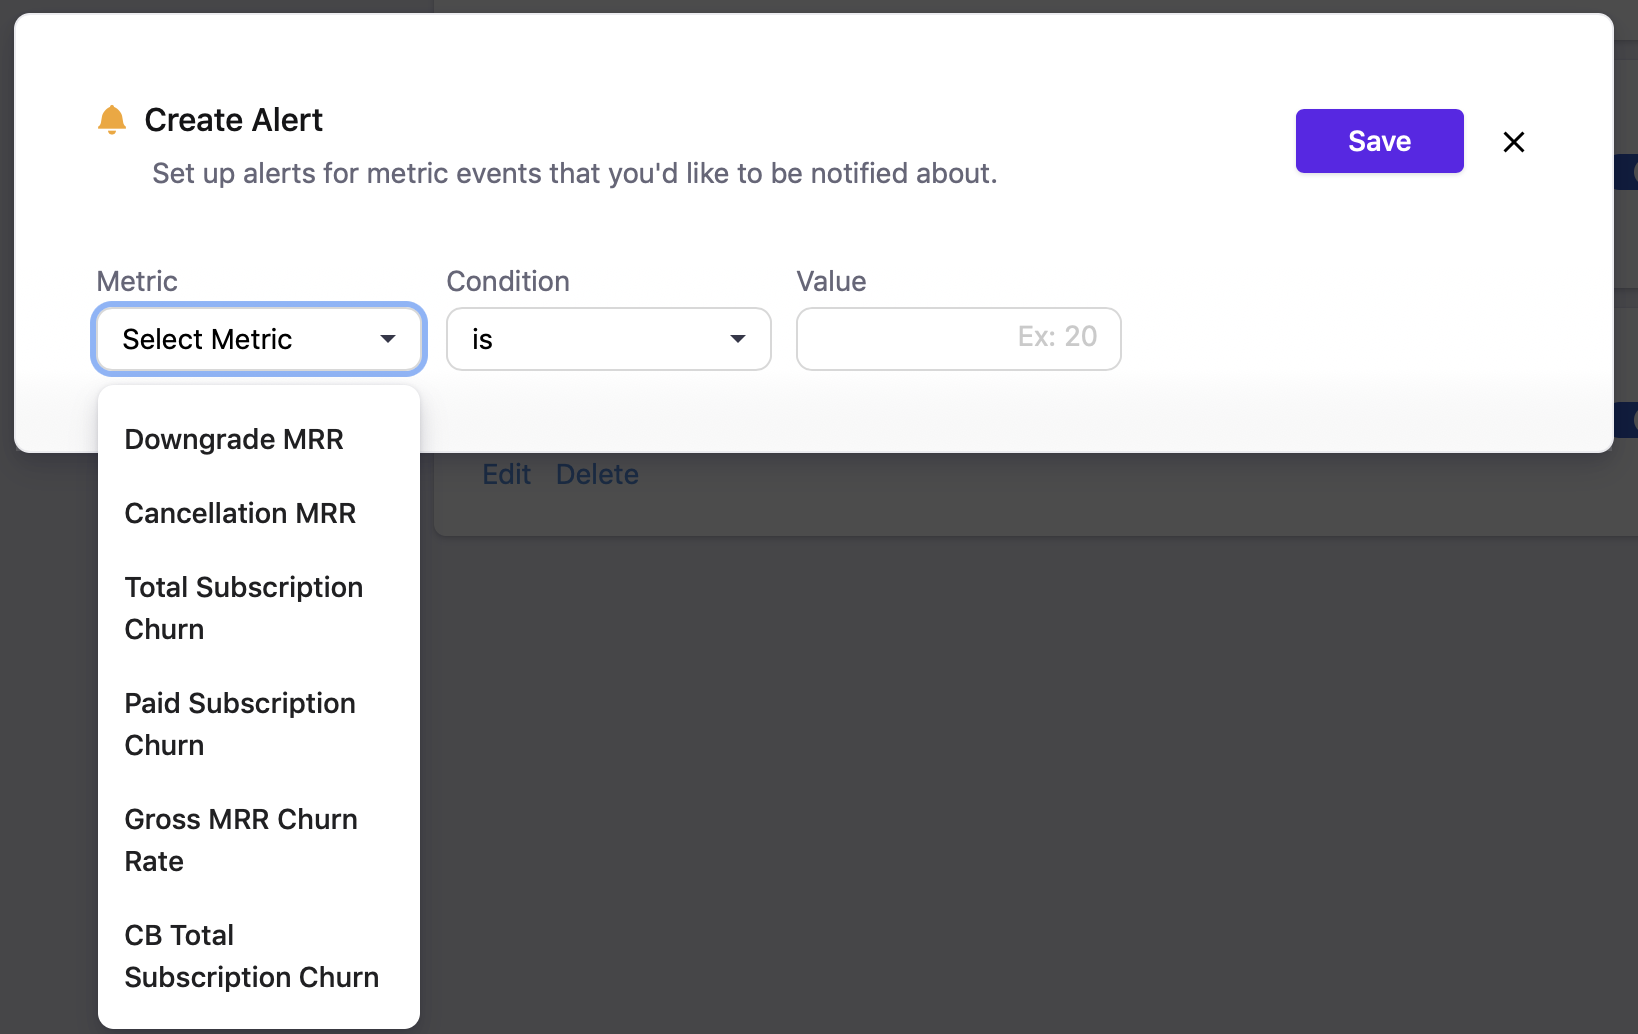
Enter the Condition and Value.
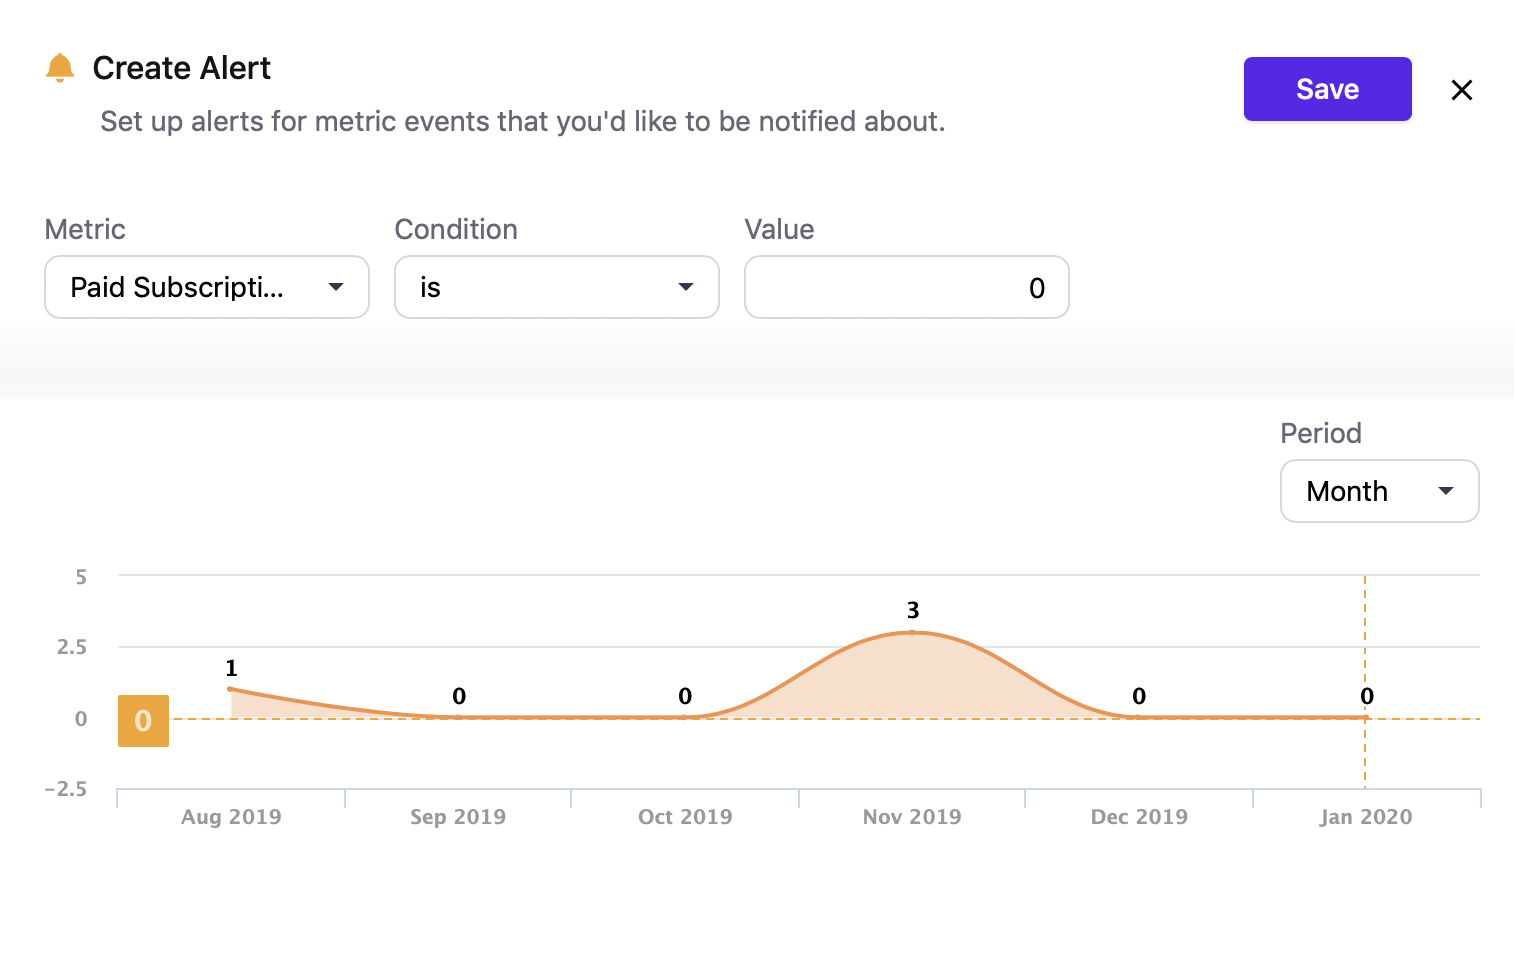
Click Save.
You have now added the alert. You can view and manage all the alerts from the Alerts and Goals tab.
Goals are used to set a threshold value for the metric. You can create goals for the following metrics in Chargebee.
To set a goal:
Click the ellipsis in the metric and click Set a Goal
Select the Type. You can add a fixed threshold or a percentage of the previous month.
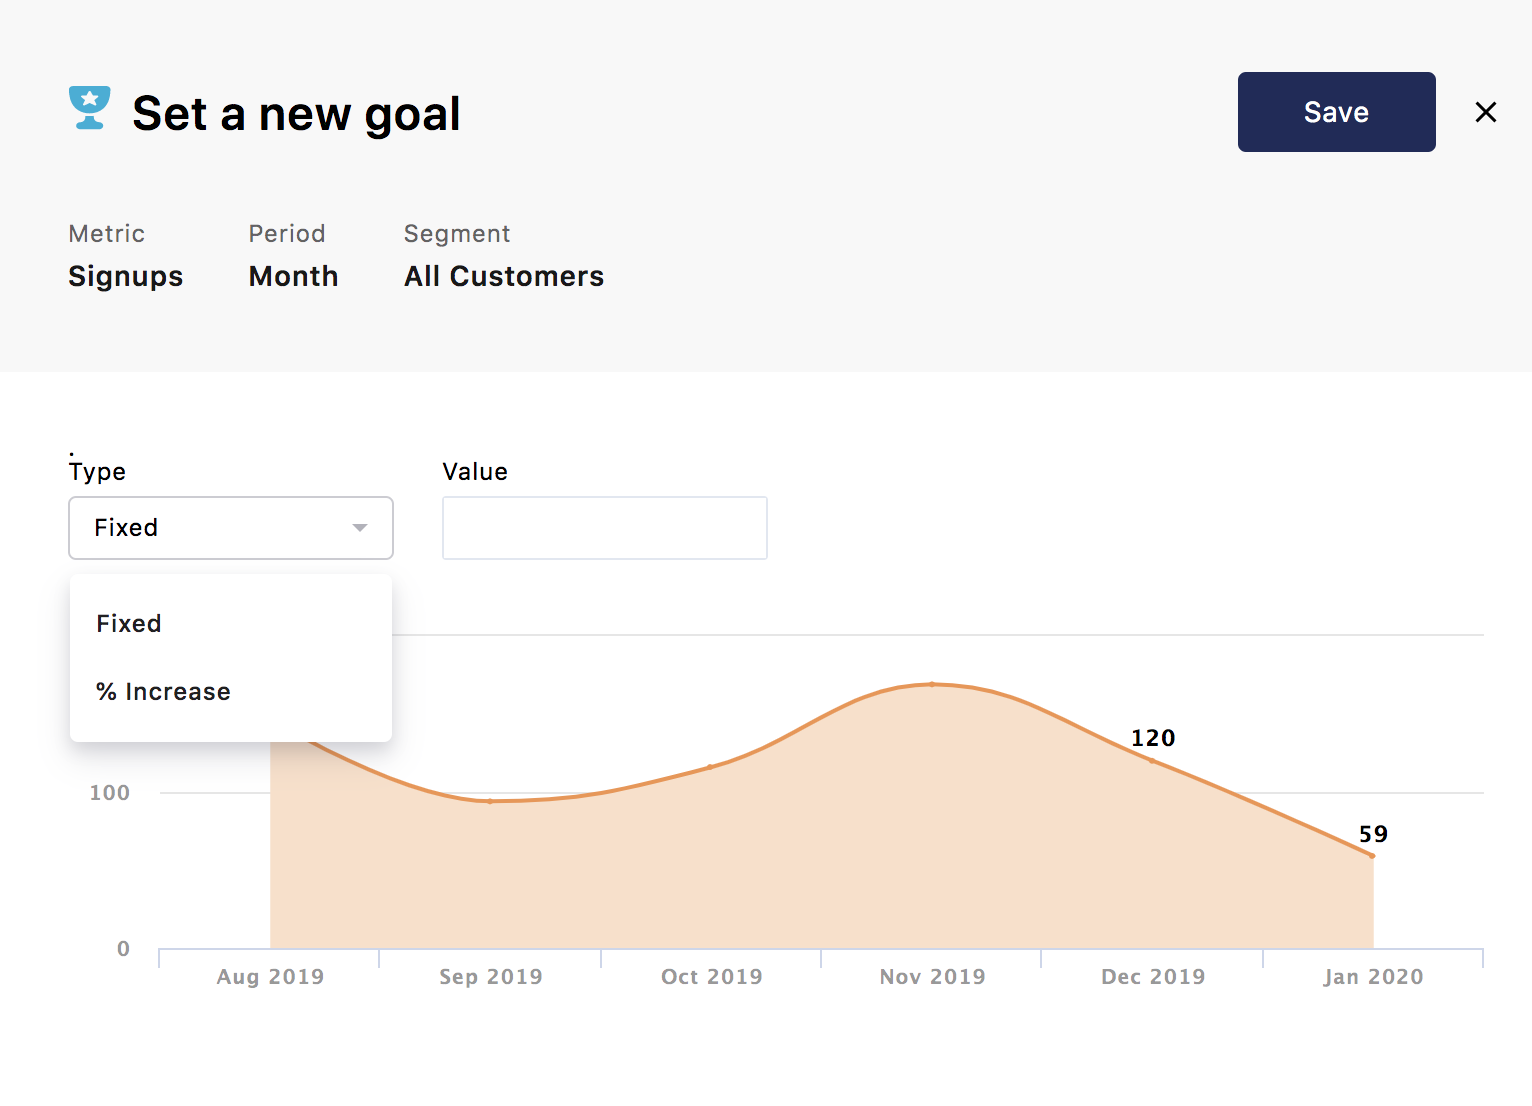
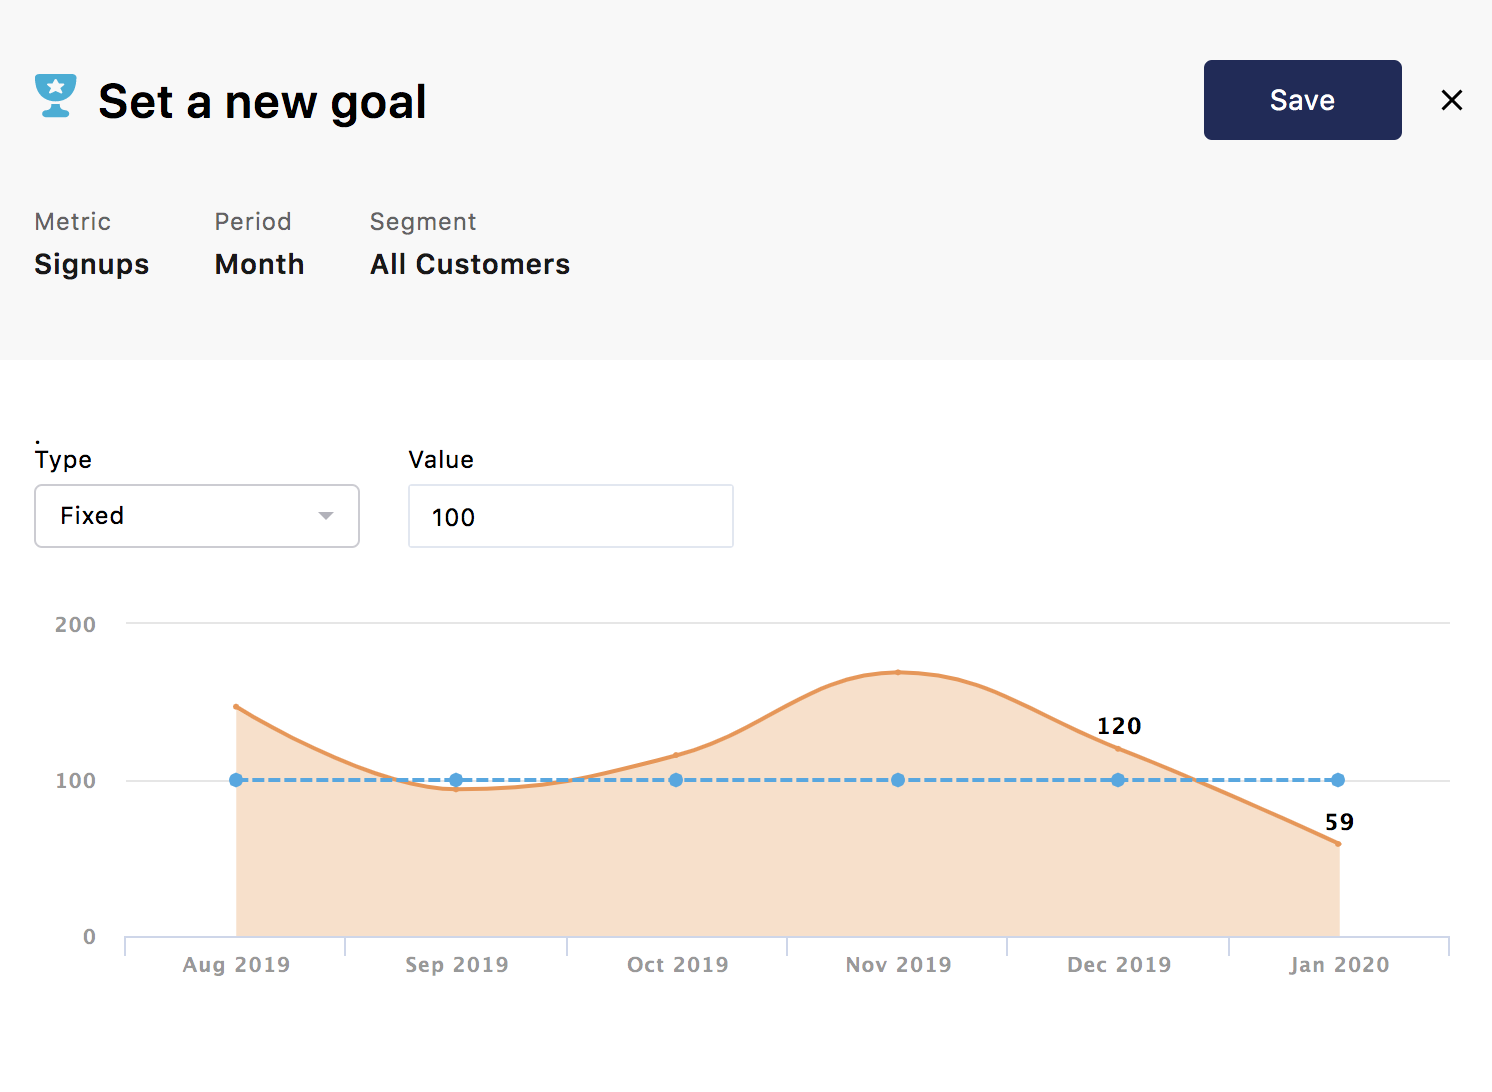
You can view and manage all the goals from the Alerts and Goals tab.
Report Builder is a powerful capability that allows you to create your own reports. The information in Chargebee is remodelled as data sources (tables) thereby enabling you to visualize any data that you want as insightful reports. Using this feature, you can transform raw data into actionable insights.
You can create Summary or Detailed Reports using the fields (columns) from different data sources.
As an analyst, you might be taking care of multiple sites and would want to see the consolidated reports across sites. RevenueStory's site consolidation feature allows you to consolidate data from different Live sites.
Update on September 25, 2020.
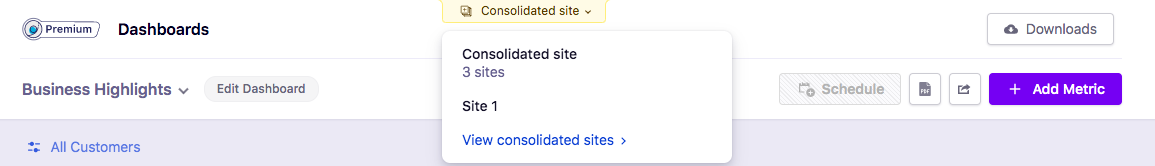
When using site consolidation, you can use the site filter option to switch between the consolidated site and primary site.
Earlier, if you have 3 sites, say Site 1, Site 2 and Site 3. You can choose a site as a primary site. The primary site will contain the consolidated information from Site 1, Site 2 and Site 3. If you have chosen Site 1 as your primary site, then you can use the Site Filter option to switch between Site 1 and your consolidated site. This gives you the leverage to view the information pertaining to site 1 as well as the consolidated information.
If you are an existing user, ensure that you recreate the dashboards that you have created in Site 1 in the consolidated site as they will not be available once Site Filter is enabled for you.
Please note that Site Filter will not be enabled by default, if you wish to use this feature, contact [email protected] .
The site consolidation feature of RevenueStory allows you to consolidate data across different sites. Sometimes when you enable site consolidation there can be a scenario where the same customer is present in more than one of the sites. For example, a company called Acme can have multiple sites for each of its products - Acme CRM, Acme Books, Acme Marketing. Now, there is a possibility that a single customer (say John Doe) is using all of these products, which means there is a record for John Doe in all of the sites.
Now, when site consolidation is enabled, John Doe is counted thrice, as the record is available in three different sites. To avoid this, follow the below steps:
The custom fields feature allows you to add an additional attribute to your reports. For example, you might want to know which acquisition channel has brought you the significant new MRR. This information can be added in Chargebee as a custom field and fetched from RevenueStory to display the data you want.
The following Custom Fields are supported:
| Resource |
Custom Field |
Type |
|---|---|---|
| Customer |
Business Type |
String |
| Business Vertical |
String |
|
| Acquisition Cost |
Long |
|
| Acquisition Channel |
String |
|
| Sales Agent |
String |
|
| Customer Type |
String |
|
| Acquisition Mode |
String |
|
| Account Manager |
String |
|
| Customer Success Agent |
String |
|
| Solution Partner |
String |
|
| Freemium Blacklist Reason |
String |
|
| Unique Customer Handle |
String |
|
| Product Usage |
Long |
|
| Subscription |
Product Usage |
Long |
| Sales Agent |
String |
|
| Solution Partner |
String |
|
| Acquisition Cost |
Long |
|
| Cancel Reason |
String |
|
| Plan |
Plan Group |
String |
| Addon |
Addon Group |
String |
This is a premium feature. Please contact [email protected] to enable this.