A Step-by-Step Guide to Churn Analysis

Monitoring customer churn is crucial when it comes to keeping tabs on your business. But is that all there is?
If your churn rate is creeping up, what does it tell you? How do you put an action plan together to tackle it?
That’s where customer churn analysis comes in.
What is Churn Analysis?
Customer churn analysis is the process of using your churn data to understand:
- Which customers are leaving?
- Why are they leaving?
- Which customers are likely to churn shortly?
- What can you do to reduce churn?
As you may have guessed, churn analysis goes beyond just looking at churn rates. It’s about understanding the underlying cause and curbing churn in time using data.
Sure, customer attrition is inevitable. But what if we see it as an opportunity to learn, improve customer retention, and close any leaks in your revenue stream?
Let’s look at the things you can uncover while analyzing churn.
Importance and Benefits of Churn Analysis
Churn analysis enables you to identify pain points in the customer journey and opens up avenues to improve your products, services, and communication.
Unravel weaknesses (and strengths) of your product
Churn analysis often reveals patterns that indicate common motivators for customers to leave you, such as price sensitivity or poor product adoption. It also demonstrates how customers engage with your product throughout their lifecycle. You can use these learnings to maximize what customers already love and improve on what they don’t.
Uncover opportunities for better communication
Improving customer experience comes with a constant understanding of customer expectations and meeting their needs. Churn analysis reveals trends in customer behavior at every touchpoint. Personalized engagement through the communication channels that your customers prefer is one way to make customers feel valued and appreciated.
Predict and thus reduce future churn
Churn analysis involves analyzing historical customer data to make churn prediction possible. You can also use Customer lifetime value (LTV) analysis to understand customers at every lifecycle stage and who’s sticking with your product. That means you can be proactive in your approach and prioritize improving retention when you notice the red flags indicative of churn.
Unleash the secret weapon during a crisis
Churn analysis is beneficial at all times, but more so in this downturn induced by a global pandemic. New customer acquisition cost (CAC) is 5x higher than the cost of retaining existing customers.
Our customer ‘Rented’ analyzed the local impact of COVID and gave limited time discount offers. It helped in retaining 80% of their customers!
When companies focus on keeping the business running during a crisis, churn analysis can help identify at-risk customers.
Different Types of Churn
Customers cancel for various reasons and in multiple ways. You require a different set of action plans to tackle churn of each type. Here are some types of churn:
Voluntary Active Churn
These are customers that cancel your product or service. This type of churn can occur due to various reasons, such as poor onboarding, poor customer service, or switching over to the competitor. This type of churn forms a large chunk of your lost revenue, and you should focus most of your strategic initiatives on preventing it.
Involuntary Passive Churn
This type of churn is a leak in your revenue stream. Involuntary churn occurs when the customer’s payment is not completed for reasons such as:
- When an expired card is used
- Hard declines happen when a card is reported lost or stolen.
- Soft declines occur when a credit card has maxed out its limit.
- Banks can decline the card (due to suspected fraudulent activity, frozen accounts, etc.)
This churn is relatively easier to curb and can be solved by implementing smart dunning workflows. Chargebee’s Dunning helped improve MRR by 35% and reduced churn by 100% for Whiteboard.
The ‘Good’ Churn
Not all churn is bad! Sometimes churn tends to weed out customers that were a bad fit for your product, service, or business model. Another example of ‘good’ churn is when customers leave after their short-term need with your product is satisfied, like an event or a short-term project. It’s also called ‘happy’ churn. These customers also tend to reactivate their subscription later, so one way to track ‘happy churn’ is to track reactivation MRR.
The Downgrade Churn
As the name suggests, this churn occurs when customers downgrade to a lower-tier plan, resulting in downgrade MRR. It could happen due to:
- Price sensitivity
- Value proposition misalignment
You can reduce this churn by experimenting with your product packaging and pricing. To reduce downgrade churn, think of ways to pack more value and features in your customer’s current plan.
3 Step Process to Perform Churn Analysis
Too much data can be overwhelming and lead to analysis paralysis. We’ve all been there. So instead of jumping headfirst in the whirlwind of data and hoping you get lucky with actionable insights, it’s always easier to work with a framework.
Step 1: Invest in subscription analytics
Step 2: Analyze Customers by Segments
Step 3: Find Out When and Why Churn is Occurring
Step 1: Invest in subscription analytics
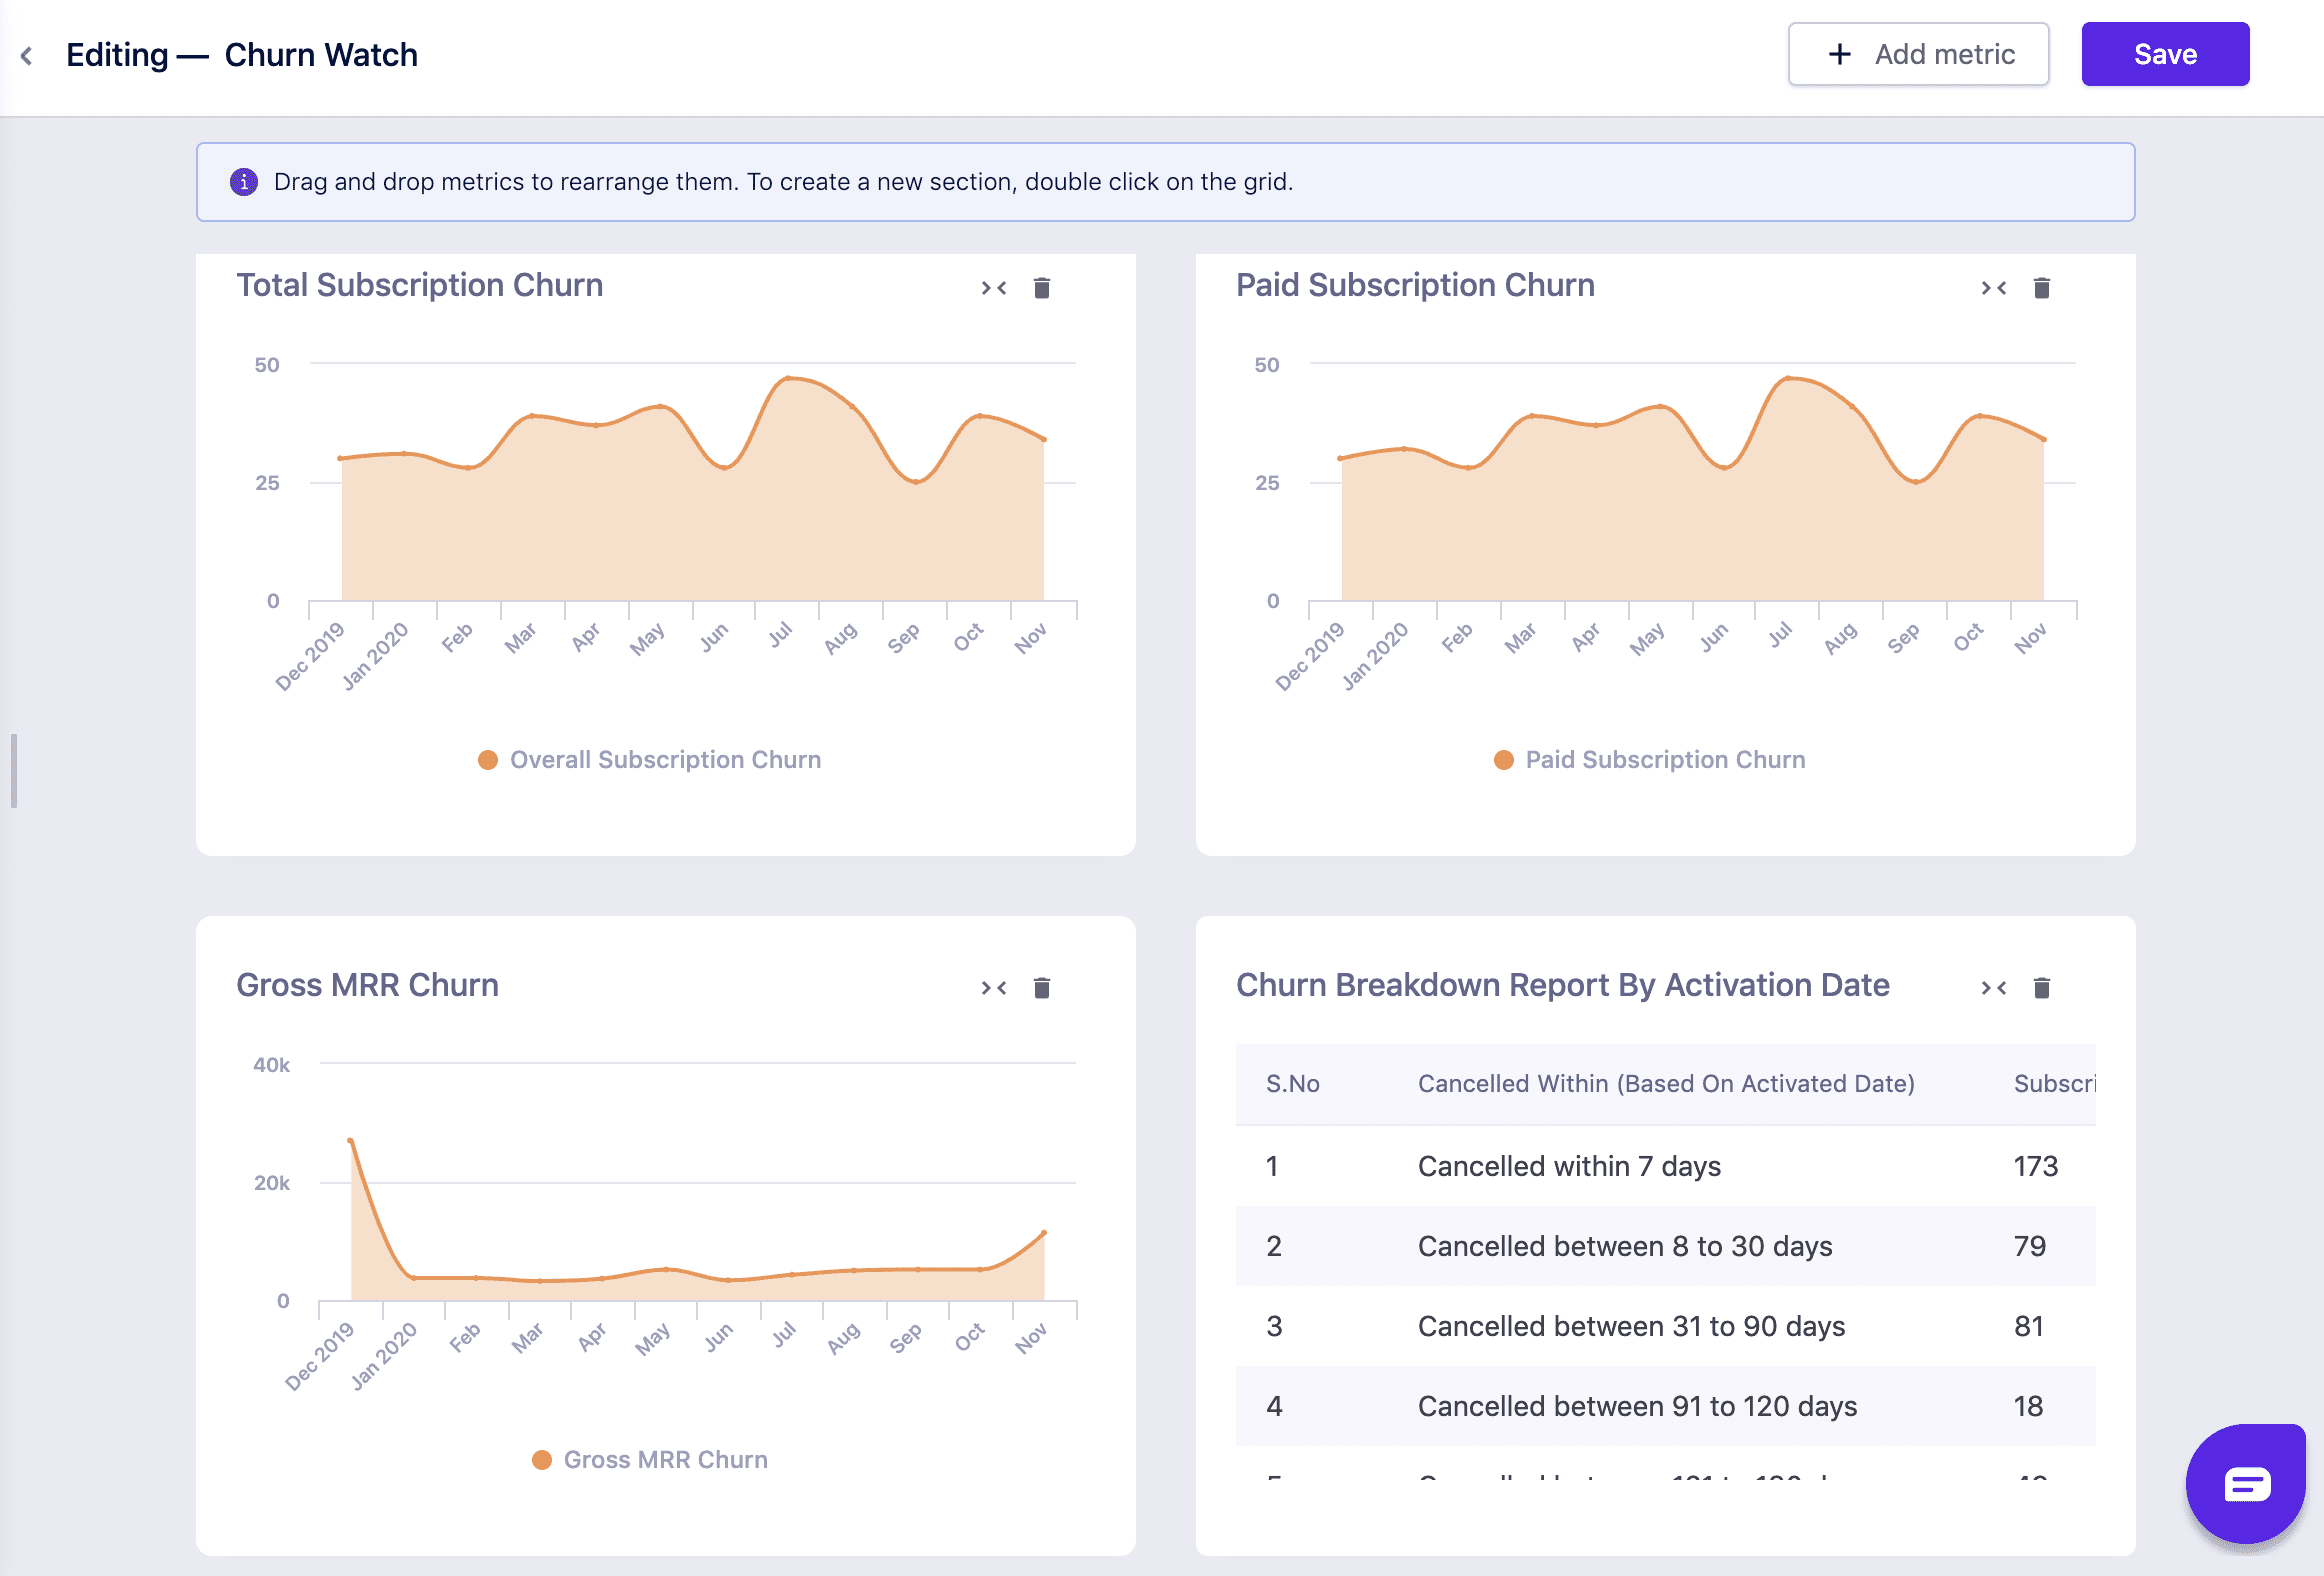
Subscription analytics tools allow you to see all your metrics – including churn – at a single glance. You have all your data and metrics in one place, with multiple ways of slicing and dicing it. Take a look at the ‘Churn watch’ dashboard here:
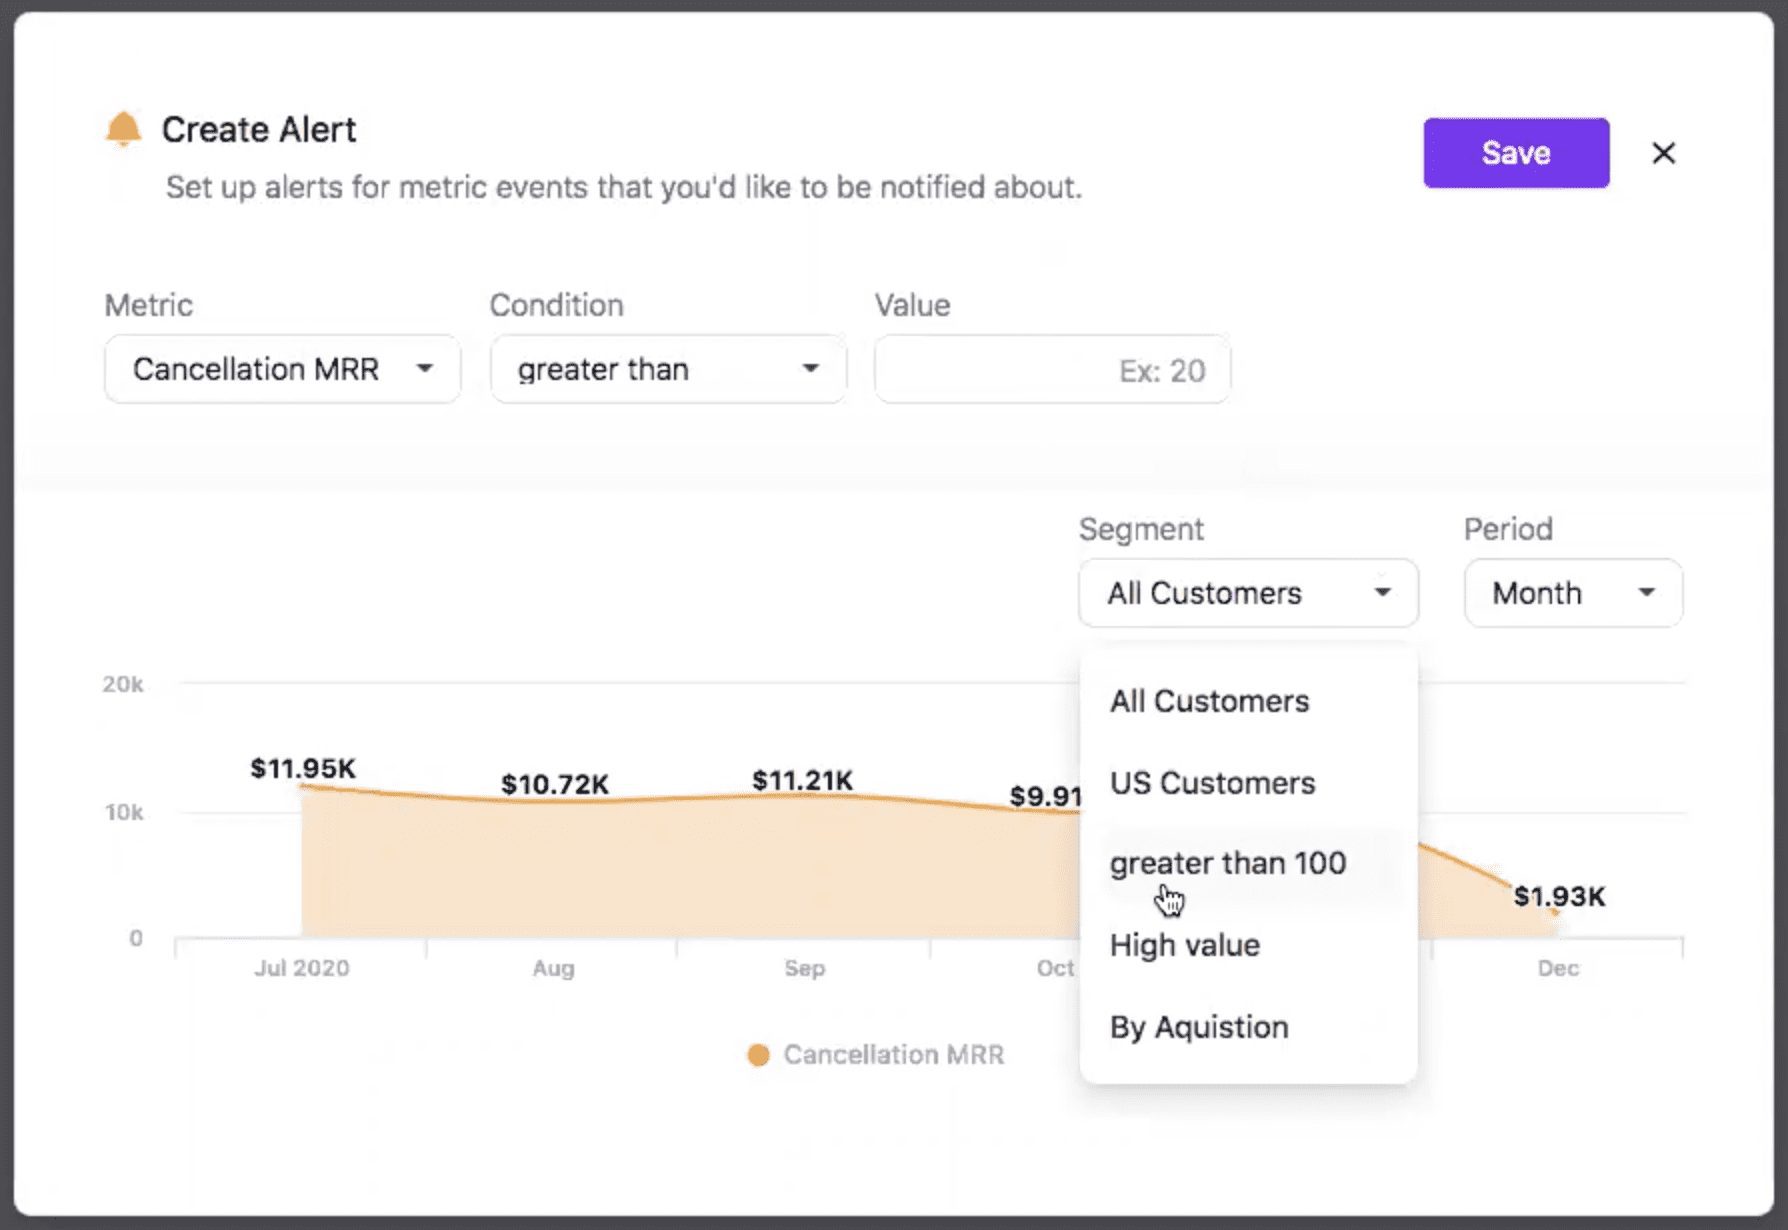
Churn analysis helps you proactively identify customers who are likely to churn. Creating alerts to notify you about any adverse change in real-time, is a great way to stay on top of your churn metrics. You can create such custom alerts in Chargebee’s RevenueStory.
RevenueStory is a subscription analytics platform built in tandem with the billing system. RevenueStory allows you to drill-down to the deepest layer of all the metrics and reports, including churn metrics and more. Curious how? Try it out here.
Step 2: Analyze Customers by Segments
Customer segmentation is the process of grouping your customers with various similar traits. It can help you uncover trends in customer churn. Choose a tool that allows configurable segmented analysis of churn. You should be able to analyze churn by revenue, business type, or demographics.
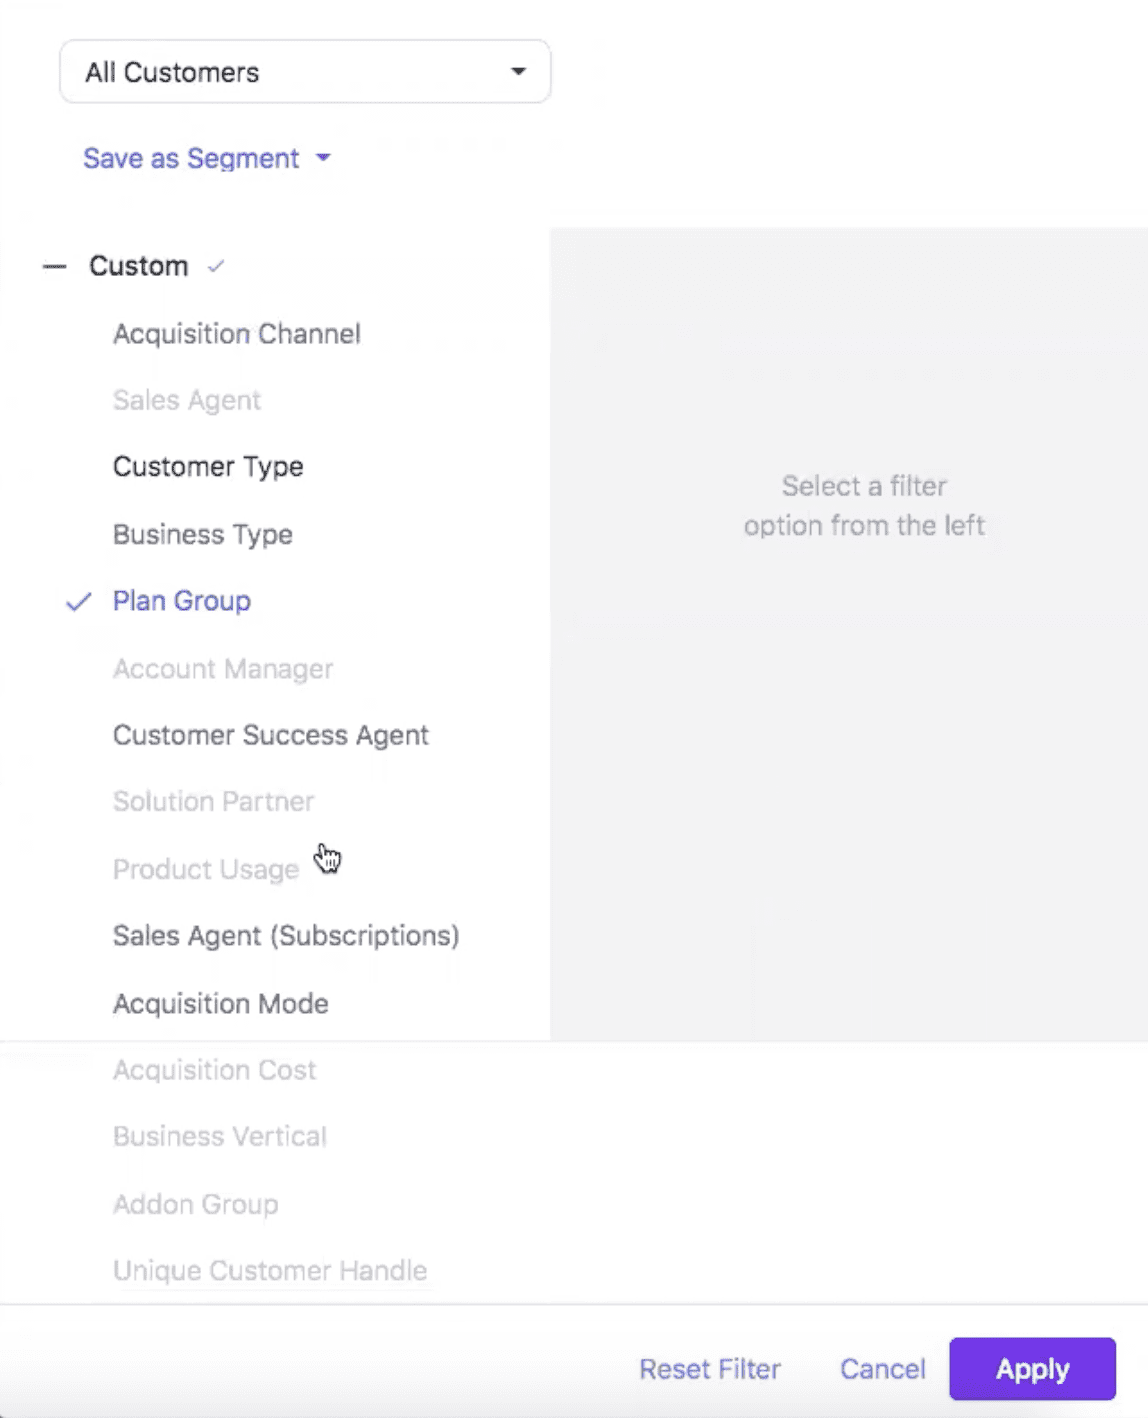
You can conduct churn analysis across customer segments in the following ways:
1. Churn Analysis by Revenue
This type of segmentation divides customers into groups based on their revenue. Early-stage start-ups might be churning because of budgetary issues, and you can reduce this churn by offering them discounts and flexibility in payment terms. For enterprises, you need to ensure that your product has scaled along with the company’s growth.
2. Churn Analysis by Industry
This analysis helps in preventing churn by implementing specific measures for each sector. For instance, the global downturn induced by the COVID pandemic crippled the travel industry, but e-learning saw a surge as students took to remote learning. You can implement the following measures to reduce churn in sectors facing a slowdown.

3. Churn Analysis by Geography
Knowing your customer’s location adds context to why they would be churning. Tax regulations, payment gateways, and payment processing are different for every country, affecting your product’s adoption. For SaaS businesses, it is crucial to comply with the local sales tax guidelines. Your subscribers could be churning due to a lack of payment options or a lack of compliance with regulations, and this analysis is a great way to spot such trends.
Step 3: Find Out When and Why Churn is Occurring
Only when you know why the churn occurred will you formulate pointed strategies to curb it. There are majorly two types of churn:
Voluntary vs. Involuntary Churn
Exploring what % of churn was voluntary and involuntary gives excellent insights into churn prevention workflows and strategies you would be setting up.
Early vs. Late Stage Churn
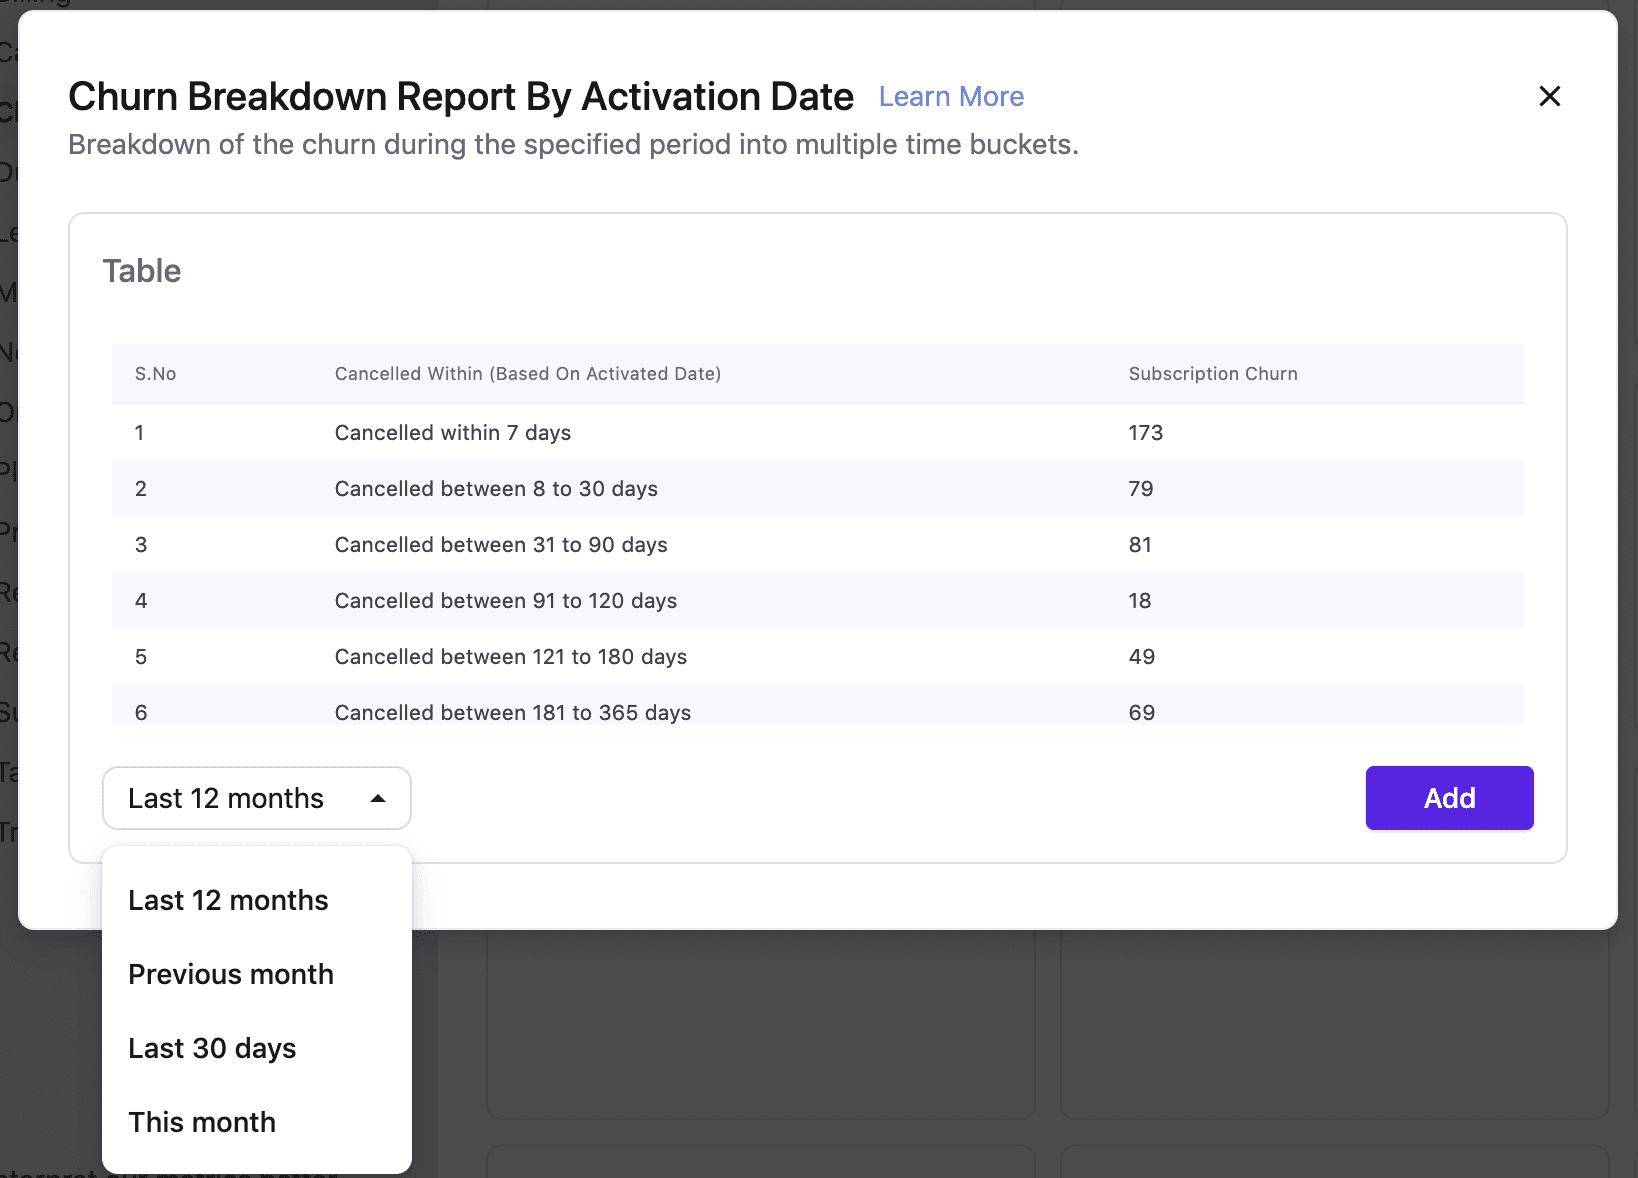
Analyzing the timing of the churn adds depth to your churn analysis. There are various ways to look at this. You can start by analyzing churn by activation dates. It tells you how soon (or not) the customer churned after activating the product.
Another way to analyze this is by looking at the MRR retention cohorts. The MRR retention cohort can give you a visualization of MRR addition, growth, and churn behavior based on both when you acquired the customer and what happened in a particular month.
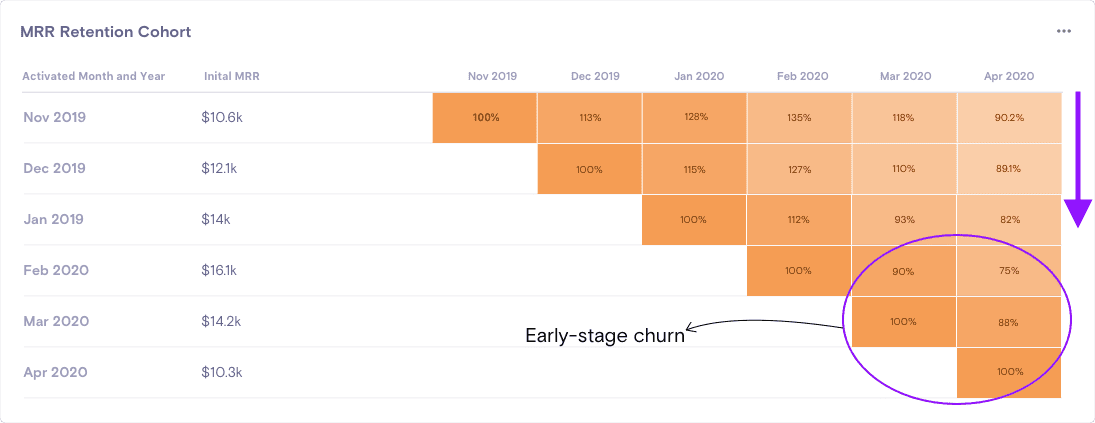
Moving down the first row shows you how much new revenue you could acquire month on month while going across columns shows how much that cohort expanded or contracted. In the cohort above, you can see an adverse impact on revenue growth across customers in April. But what’s more interesting is that customers acquired in the recent months seem to have churned more than the older ones – indicating a high early-stage churn.
Closing Notes
There are so many ways the churn data can be sliced and diced. The 3-step guide we discussed covers the main aspects of churn:
Who is churning?
Where are they churning?
When and why are they churning?
Equipped with this information, you’re all set to reduce customer churn and improve retention. I have also compiled a list of ten actionable strategies to reduce churn here. Check them out!
