PRODUCT
SOLUTIONS
- BY INDUSTRY
- B2B SaaS
- eCommerce
- E-learning
- Publishing
- BY BUSINESS SIZE
- Startup
- ScaleUp
- Enterprise
- BY BUSINESS MODEL
- Self-serve
- Sales-driven
CHARGEBEE RETENTION
Retention
What is Revenue Churn?
Customer Churn VS Revenue ChurnRevenue Churn Formula
Revenue Churn is derived as the ratio of revenue lost through cancellations during a given period versus the revenue available at the beginning of that period. It’s usually expressed as a percentage.
Revenue Churn = (Churned MRR)/(MRR at the beginning of the period)
Customer Churn VS Revenue Churn

How should a business interpret Revenue Churn?
Churn is mostly inevitable and is caused by a variety of reasons such as cancelled subscriptions due to lack of perceived value and credit card expiry, categorized as voluntary and involuntary churn.
But, you can gain key insights from revenue churn, if you tailor the formula to find Gross MRR Churn or Net MRR Churn.
Gross MRR Churn
Gross Monthly Recurring Revenue Churn attempts to show how much revenue is being lost, irrespective of how much you may be expanding within the existing customer base via expansion and upgrades. In this way, Gross MRR churn helps focus on how much revenue leakage is happening.
Gross MRR Churn Rate = [(Downgrade MRR + Cancellation MRR) / (Total MRR at the beginning of the period)] * 100
Net MRR Churn
Net Monthly Recurring Revenue Churn, on the other hand, attempts to paint a picture of the final reality after taking into account what’s lost (via cancellations, downgrades) and what’s gained (via expansion, reactivation and upgrades).
Net MRR Churn Rate = [(MRR beginning of the month - MRR end of the month) - (Expansion MRR)] / [(MRR beginning of the month)] * 100
Net MRR Churn can be a negative churn. That’s to say the business is making more money out of a cohort of customers than it’s losing from the same cohort, in that period of time.
MRR Retention Cohort
Also, to stay on top of churn, you need to analyze your SaaS metrics. MRR Retention Cohort would be one of the charts you need to analyze. This chart will show you churn behavior based on both: when you acquired the customer and what happened in a particular month.
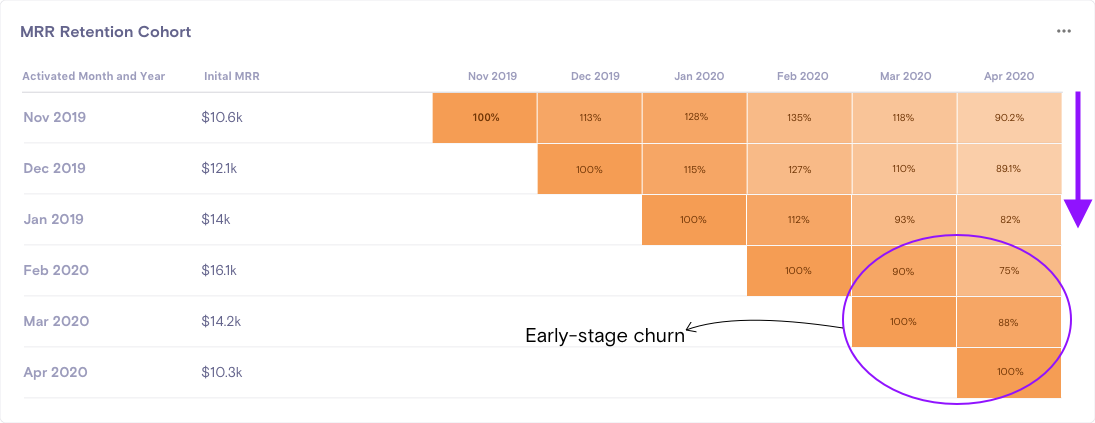
Moving from left to right, you get an indication of change in MRR. And moving down rows, shows you how much new revenue you could acquire month on month. In the cohort above, you can see an adverse impact on revenue growth across customers in April.